Remove 2007 Remove Creativity Remove Infographics Remove Technology
article thumbnail

10 insights for public relations from the 2017 European Communications Monitor

Stephen Waddington

Most organisations use more elements like online videos, infographics and instant photos in their messaging. However, longitudinal data collected since 2007 from nearly 25,000 communication professionals throughout Europe has repeatedly found the strategic alignment of communication and organisational goals as the most important issue. #4

article thumbnail

SHIFT Archives: The Best of Q2 2015

Shift Communications

It’s certainly possible, using predictive analytics, to get a rough sense of what might work and what might not work, but few companies have access to that much technology and expertise. In early 2007, SHIFT CEO Todd Defren commissioned a map of the social media world to better visualize the industry landscape.

Insiders

Sign Up for our Newsletter

This site is protected by reCAPTCHA and the Google Privacy Policy and Terms of Service apply.

article thumbnail

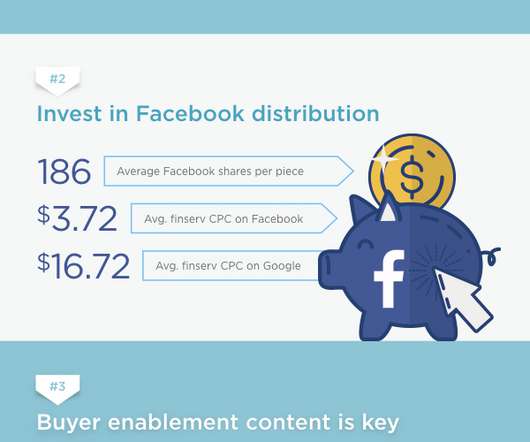
Financial Services Content Report: Industry Benchmarks & 5 Keys to Success

Contently - Strategy

This number includes content creation, distribution, technology, and talent. However, the other industries like travel, technology, and healthcare boasted a better average engagement rate (70 percent) and finish rate (60 percent) in 2019. Create social videos and infographics. Get creative with compliance.

Financial 111
article thumbnail

Social Media Game of Thrones: A Song of PR and Social

Shift Communications

In early 2007, SHIFT CEO Todd Defren commissioned a map of the social media world to better visualize the social media landscape. Then we cut the treemaps into individual squares and gave them to our Creative Services team. Vice President, Marketing Technology. Analytics Data Data-Driven PR Infographic'