This site uses cookies to improve your experience. To help us insure we adhere to various privacy regulations, please select your country/region of residence. If you do not select a country, we will assume you are from the United States. Select your Cookie Settings or view our Privacy Policy and Terms of Use.
Cookie Settings
Cookies and similar technologies are used on this website for proper function of the website, for tracking performance analytics and for marketing purposes. We and some of our third-party providers may use cookie data for various purposes. Please review the cookie settings below and choose your preference.
Used for the proper function of the website
Used for monitoring website traffic and interactions
Cookie Settings
Cookies and similar technologies are used on this website for proper function of the website, for tracking performance analytics and for marketing purposes. We and some of our third-party providers may use cookie data for various purposes. Please review the cookie settings below and choose your preference.
Strictly Necessary: Used for the proper function of the website
Performance/Analytics: Used for monitoring website traffic and interactions
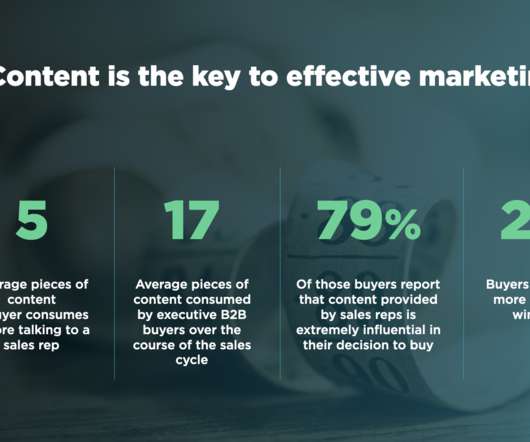
According to the Cision 2017 State of the Media Report , when communicators pair compelling messages with rich formats like photos, videos, social media posts, infographics and data, they can drive better and more accurate coverage and increase earned media opportunities. RISING 2017 MEDIA TRENDS.
Do you really know what someone else is experiencing before you tweet, blog or post on Facebook? What you see on Instagram, Facebook, Twitter, or any platform does not always give you a clear picture of someone’s life, what is going on in their world or how they are truly feeling. Of course, there’s a highlight reel on social media.
The infographic, inspired by the results, shows some of the highlights of the report, including the top trends in journalism, a look at how reporters use social and what skills communicators need to improve. For a taste of what’s in the report, check out our infographic below or download the 2016 version for free now!
Four years ago, a majority of journalists were hesitant to utilize Twitter and Facebook, and seemed especially skeptical about how these sites could help them reach audiences near and far. For a quick look at what’s in the study, check out the infographic below. With data from journalists in 11 countries, including the U.S.,
Facebook has been disrupting the scene for some time now. In 2015, brands need an ad budget to make Facebook work. In 2015, brands need an ad budget to make Facebook work. Here’s a quick overview of how to create your Facebook content plan: 1. On Facebook, your top priority as a business is to educate. Her answer?
Infographics demonstrate your brand’s expertise in your industry. Keep in mind that different pieces of your press release can serve different social media purposes: Post your images on Facebook, Twitter, or Pinterest. Share videos from YouTube to Facebook or Twitter.
Faculty might have students create blogs, use a course learning software’s discussions, or even create a Facebook Group. One way I do this is by having students create infographics around a given topic. For example, in one class I had them create an infographic about the four-step PR campaign process.
Download the full PDF version of the infographic here . Facebook is still an excellent place to do this. Over 60 percent of people worldwide are on Facebook and almost three billion users visit the site every month! 2023 is right around the corner.
On to today’s roundup… and today we’re talking Facebook. Why: In this post for Spin Sucks , Yvette Pistorio explains how to make your Facebook posts more appealing to your fans. Why: Ari Herzog offers an interesting perspective on Facebook friendships and their real-life value. Based in the Washington, D.C.,
Infographics demonstrate your brand’s expertise in your industry. Keep in mind that different pieces of your press release can serve different social media purposes: Post your images on Facebook, Twitter and Pinterest. Share videos on YouTube, Facebook and Twitter.
Then, a peer recommended SumAll, after a lengthy Facebook discussion. However, Digital Reach sample data relies on sharing activities across social media communities (Facebook, Twitter, LinkedIn, Google+), which increasingly drives web users to the content they choose to view everyday.
Facebook changed its algorithm to suppress unpaid brand posts. In this video, we’ll review the five pillars of digital marketing communications and how Facebook’s changes shouldn’t impact the rest of our marketing efforts: Search marketing. 00:00:01] Facebook is taking your brand to the woodshed. Owned media.
Check out the survey highlights in our original infographic and read more in our news release. As consumers increasingly look for relevant and engaging multimedia content, it’s no surprise that PR and marketing pros are answering the call by producing and sharing photos, video, infographics and other visual content with their audiences.
I have also advised employing your resume as the basis for your LinkedIn and Facebook profiles. Include the urls to your Google+, LinkedIn and Facebook profiles at the top of your resume along with your email address. Opening Salvo.
Infographics. I love infographics. I’m not alone, over 40 percent of marketers say infographics are their most engaging piece of content. Infographics are easy to read, easier to digest and boost engagement by up to 3x. To promote an infographic, you first have to create an infographic.
Flo has even become a bit of a celebrity with almost five million likes on Facebook. Articles with images get 94 percent more views , and pictures get 37 percent more engagement than text posts on Facebook. Infographics can be especially useful because they explain complex topics with the use of visuals.
Social media sites such as Facebook have content discovery features integrated into its algorithms. Similar to Facebook, YouTube’s “Recommended for You” section is another example of how user activity and preferences fuel content discovery. This helps users to find content that’s most suitable for them.
Post an infographic (check out www.Fiverr.com to have on easily made). Do a Facebook Live. Make a plan and it will become super easy to do! Share an inspirational quote. Answer a frequently asked question. Post something seasonal. Share an image. Repost something that went well last year. Ask your audience a multiple-choice question.
The first thing most ambitious marketers do when beginning their marketing adventure is to plan the tactics and choose the forms of the content they want to publish (blogs, videos, podcasts, infographics, etc.). Diversify content by using a variety of forms like infographics, videos, graphics and images. Growing Competition.
Engage with the audience on platforms like Instagram, Facebook, and TikTok through targeted advertising, contests, and influencer partnerships. Create valuable content, such as blog posts, videos, and infographics, to educate and inform the target audience.
Facebook is the number one mobile app. What does your Facebook content look like on mobile? Infographic courtesy of Kargo.com. Consumers expect a brand to be seen as a technology leader – image is a PR issue. How is your brand performing on mobile? Have you checked how your brand image rates in this regard?
The company also strived to be more transparent with its “Our Food, Your Questions” campaign, which included behind-the-scenes videos and infographics explaining its production process and allowed customers to have their questions answered in real-time by employees. New images. Blog post explaining new changes. Social Media. New handle.
According to the Cision 2017 State of the Media Report , when communicators pair compelling messages with rich formats like photos, videos, social media posts, infographics and data, they can drive better and more accurate coverage and increase earned media opportunities.
For example, the people coming to your website through search engine result pages (SERPs) or Facebook posts would be considered organic traffic. Photos and videos posted on Facebook earn 100 percent to 180 percent more engagement than average posts, according to Facebook. Giphographic : These are animated infographics.
That’s according to a survey of 1,200 “social dads” by Social Media Link and presented in the infographic – Dads Do Social – published nearby. In an introduction to the infographic, marketing director Jordon Ben writes: “Today’s dads are social, vocal and see their online world as a communal resource to help them make decisions.
Think about most of the people that follow you on Facebook, Twitter, Instagram and any other social network. Even Facebook is coming down on brands for over-promoting now… #5: Instead: Inspire your customers through video and audio. Chances are, they’re already a fan. Why not just play to that pride factor a bit?
Don’t Default to Facebook. It’s no secret that Facebook’s organic reach is plummeting. Now before you write off the more visual social network as for food or luxury brands, consider the benefits they offer over Facebook. Her firm still gets major website traffic from an infographic they posted over two years ago.
It’s no easy task for marketers to create Facebook ad designs. We have 11 tricks up our sleeve for you to create awesome Facebook ad designs that will wow your customers and target audience alike! According to Statista , in the fourth quarter of 2018 for Facebook, in particular, it was found that 1.52 But not to fear!
Here’s a fun infographic from the folks over at Domo about how much is happening in an Internet minute. million pieces of content on Facebook. Facebook does this mechanistically, as those of you who operate Facebook Pages on behalf of your brand well know. Lots and lots of content. In one internet minute, people share 2.4
On Facebook, Twitter, YouTube, and all those other social networks. Facebook : How many Likes? How do they publish to Facebook? Do they use Facebook ads? Cool infographics. To get people to click on social media (and especially Facebook), you need to perfect these tactics: Headline. You know the ones I mean.
How much will you need to pay Facebook? Facebook was busy in the first quarter of 2014, and when news of its updated news feed algorithm hit the airwaves, the media was buzzing. In late March, it was revealed that Facebook throttled the organic, non-paid reach of brand pages…again. Marketing Analyst.
My friends over at Rad Campaign gave me a heads up on an interesting infographic over at craigconnects , that says it “cracks the crowdfunding code.” Debra Askanase, who recently joined the National Brain Tumor Society and who worked at FirstGiving in the past agreed that the tips in the infographic are spot on.
Summarise your company’s year in an infographic which can be used: during staff meetings to thank everyone for their contribution. Here’s a short list of Christmas tactics you might want to roll out like a sleigh: Find a charity for your organisation to support this Christmas season (which may be in addition to charities you already support).
A 2014 study of more than 72,000 Facebook pages shows that visuals, including video and photos, generate the highest levels of engagement among users. Think about how many times you’ve seen a text-based article go viral – and compare that to cute kitten photos, the ALS Ice Bucket Challenge or infographics.
This is a pretty neat infographic that I found (and I’m not usually an infographics fan) via the folks at Visually. A Brief History of Presidents Day infographic. Twitter Facebook Google+ LinkedIn A Cheat Sheet on President’s Day. A Cheat Sheet on President’s Day is a post from: Waxing UnLyrical.
Create social videos and infographics. Invest in paid distribution on Facebook. Create social-friendly videos and infographics. Our industry analysis found that videos and infographics outclassed other content formats in terms of average social shares. Infographics, meanwhile, saw twice as many shares as articles. (We’ll
Facebook recently reported that it receives more than 4 billion video views each day , more than YouTube. According to a report from Ogilvy and Tubular Labs , 725 of the 1,000 most popular Facebook videos at the beginning of 2015 were re-uploaded from outside sources.
People on Twitter aren’t looking for the same type of content as people on Facebook and vice versa. While text-heavy content is not very inviting, multimedia like interactive quizzes, infographics and live videos will be more likely to attract attention. Be sure to adapt your messaging based on the platform you use.
Extract Data from your Content and Design an Infographic. People love infographics. So why not repurpose your written content into a well-designed and impactful infographic? An Infographic is a way of exposing your content to more readers. An infographic is 30X more likely to be read than text-based content.
Here’s an example: Facebook. The newsfeed (Timeline) on Facebook, as with so many other platforms, has become a battle for eyeballs. Infographics are your key language elements here. Take an image and create a visually engaging infographic by adding important data points, or create a diagram to highlight elements of interest.
Another participant bemoaned anemic conversion rates on direct response ads sent via Facebook and LinkedIn. When I say “content,” I’m not just talking about top-funnel blog posts or infographics. Now he was scrambling to put together a digital-first marketing plan. How are you going to change?
Here, you can find ebooks, infographics, webinars and templates to help you: Grow blog traffic. Some examples include: How to Build an Email List With Facebook. This marketing software company understands the value of providing useful resources, and has invested heavily in its marketing library of resources. Design a website.
Live video was a common thread of conversation at many #SMMW16 sessions, and the wealth of information about Facebook Live, Periscope and Blab was abundant. Facebook Engagement. 1 Facebook marketing expert, Mari Smith dropped some serious knowledge bombs during her session. Live Video. As the world’s No. nealschaffer #SMMW16.
More and more, IROs are incorporating photos and video into their IR websites and using infographics to emphasize important data in their earnings reports. Salesforce uses infographics to highlight important points in its earnings reports. Playing to a visual world.
We organize all of the trending information in your field so you don't have to. Join 48,000+ users and stay up to date on the latest articles your peers are reading.
You know about us, now we want to get to know you!
Let's personalize your content
Let's get even more personalized
We recognize your account from another site in our network, please click 'Send Email' below to continue with verifying your account and setting a password.


Let's personalize your content