This site uses cookies to improve your experience. To help us insure we adhere to various privacy regulations, please select your country/region of residence. If you do not select a country, we will assume you are from the United States. Select your Cookie Settings or view our Privacy Policy and Terms of Use.
Cookie Settings
Cookies and similar technologies are used on this website for proper function of the website, for tracking performance analytics and for marketing purposes. We and some of our third-party providers may use cookie data for various purposes. Please review the cookie settings below and choose your preference.
Used for the proper function of the website
Used for monitoring website traffic and interactions
Cookie Settings
Cookies and similar technologies are used on this website for proper function of the website, for tracking performance analytics and for marketing purposes. We and some of our third-party providers may use cookie data for various purposes. Please review the cookie settings below and choose your preference.
Strictly Necessary: Used for the proper function of the website
Performance/Analytics: Used for monitoring website traffic and interactions
When LinkedIn first rolled out, it was a useful place for people to network, search for jobs, and share updates — and look up whatever happened to that coworker from 10 years ago. With more than one billion members, LinkedIn can be a key platform for promoting and building a business’s brand. Take, for example, TD Bank.
Did you know LinkedIn has its own proprietary search algorithm? The details are top secret, but according to Yumi Wilson, manager of corporate communications at LinkedIn, there are several ways to use LinkedIn to get the most from the platform. #1 1 Complete Your LinkedIn Profile. 3 Join LinkedIn Groups and Engage.
I have also advised employing your resume as the basis for your LinkedIn and Facebook profiles. Include the urls to your Google+, LinkedIn and Facebook profiles at the top of your resume along with your email address. Opening Salvo.
Connect with Melissa on LinkedIn. Connect with her on LinkedIn. Check out Chris’s infographic board on Pinterest. Follow Agnes + Day on Twitter: @agnesdayinc. Learn more about what we do and how we do it: [link]. Check out our Crisis Intelligence Blog. Check out Chris Syme’s blog. Follow Chris on Twitter: @cksyme.
Check out the survey highlights in our original infographic and read more in our news release. As consumers increasingly look for relevant and engaging multimedia content, it’s no surprise that PR and marketing pros are answering the call by producing and sharing photos, video, infographics and other visual content with their audiences.
However, Digital Reach sample data relies on sharing activities across social media communities (Facebook, Twitter, LinkedIn, Google+), which increasingly drives web users to the content they choose to view everyday. Many publishers are not obligated to share these numbers and it’s often difficult to find the information.
Take a look… Why Suze Orman Never Multi-Tasks from LinkedIn (54,963 views, as of 11/19/14) Top 100 HR To Follow On Twitter from WittyParrot (2,576 views in two days, as of 11/19/14) 7 Myths of Startup Financing from Reid Hoffman (18,344 views in two weeks, as of 11/19/14) Pretty impressive , right?
LinkedIn’s publishing platform gives founders a free outlet for thought leadership content that can catch media attention. Focus on truly newsworthy announcements and include multimedia elements like images, videos, and infographics that make your story more shareable. Press releases still matter but require a modern approach.
LinkedIn launched in 2003 with 4500 members. While other social media channels are a mix of news, silly photos and viral videos, LinkedIn continues to be viewed as the largely no-nonsense site for business. For communications pros, LinkedIn can be a great channel to connect with company decision makers, colleagues and journalists.
Infographics and Graphics. Infographics are another great visual addition to your content marketing arsenal. There are even tools to help you create your own infographics, like Piktochart. LinkedIn Blog Posts. I’ve had hundreds of views for blog posts I’ve published through LinkedIn.
The company also strived to be more transparent with its “Our Food, Your Questions” campaign, which included behind-the-scenes videos and infographics explaining its production process and allowed customers to have their questions answered in real-time by employees. Social Media. New handle. Updated bio. Tweet explaining changes. New handle.
Another participant bemoaned anemic conversion rates on direct response ads sent via Facebook and LinkedIn. According to LinkedIn, a whopping 78 percent of marketers expect to increase their content budget next year. When I say “content,” I’m not just talking about top-funnel blog posts or infographics.
Barnes to forgive me the editorial liberty I’ve taken with this headline, but that’s my takeaway after finally reading the UMASS Dartmouth Study: The 2014 Fortune 500 and Social Media: LinkedIn Dominates As Use of Newer Tools Explodes. Infographic: Millennials and Social Commerce. For example: 13 Statistics from an Inc.
Summarise your company’s year in an infographic which can be used: during staff meetings to thank everyone for their contribution. You may want to develop Christmas social media tiles for staff to use on their individual LinkedIn profiles, too. on your corporate website and social media. in your enewsletter.
My friends over at Rad Campaign gave me a heads up on an interesting infographic over at craigconnects , that says it “cracks the crowdfunding code.” Debra Askanase, who recently joined the National Brain Tumor Society and who worked at FirstGiving in the past agreed that the tips in the infographic are spot on.
When people hear the word ‘LinkedIn,’ they think of a professional networking platform. However, LinkedIn offers more than job postings and professional connections. LinkedIn has 1 billion members in over 200 countries and territories worldwide. Use LinkedIn to forge meaningful connections.
“This free, social CRM tool plugs right into your Gmail and provides a photo of your contact, an overview of their LinkedIn profile, company, title, location, Twitter, and connections you have in common,” she says. “In our world of getting-shorter-all-the-time attention spans, pictures (videos, infographics, etc.)
This is a pretty neat infographic that I found (and I’m not usually an infographics fan) via the folks at Visually. A Brief History of Presidents Day infographic. Twitter Facebook Google+ LinkedIn A Cheat Sheet on President’s Day. A Cheat Sheet on President’s Day is a post from: Waxing UnLyrical.
Each “best of” summary will also be condensed into an infographic for Pinterest, linking back to the original transcript. My favorite “best of” tweets will also be turned into individual images for Twitter and LinkedIn, building visibility for the chat “brand” and linking to the full chat transcript.
Each “best of” summary will also be condensed into an infographic for Pinterest, linking back to the original transcript. My favorite “best of” tweets will also be turned into individual images for Twitter and LinkedIn, building visibility for the chat “brand” and linking to the full chat transcript.
Extract Data from your Content and Design an Infographic. People love infographics. So why not repurpose your written content into a well-designed and impactful infographic? An Infographic is a way of exposing your content to more readers. An infographic is 30X more likely to be read than text-based content.
Fortunately, I found many of the ideas in the following infographic, produced by the no longer active Creattica, fun and motivating: “Read a page of the dictionary” is my favorite (am I the only one who used to do this as a kid??). The post 29 Ways to Stay Creative [Infographic] appeared first on Solo PR Pro.
A provocative blog post can be distilled in to a series of digital videos, or a C-level Q&A posted on LinkedIn or another social platform. Survey results can easily become infographics or the centerpiece of a customer newsletter.
Or you can edit the same blog into an infographic or share pull quotes from the piece on social media. It might get you many hits today, but repurposing it to an excellent LinkedIn post a week later might not get you the same results if you had posted about it in real-time. All these iterations fall under content repurposing.
You can connect with Nick on Twitter and LinkedIn. In this infographic from Wishpond , I’ll show you 14 data-backed techniques for designing higher-converting landing pages. Nick is Chief Product Officer at Wishpond. Wishpond makes it easy for marketers to create landing pages and contests, track leads, send emails and more.
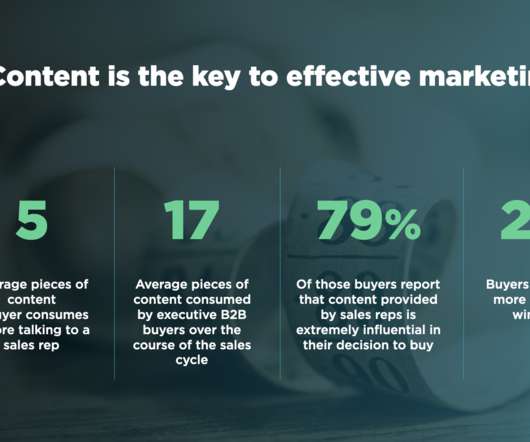
For example, a meme appearing in my stream on LinkedIn stated to the effect, that 80% of sales close on the fifth interaction, yet most sales people rarely go beyond one or two touches. If you enjoyed this post, you might also like: Infographic: Nurturing the Gap between Marketing and Sales. What needs to happen?
You can connect with her on LinkedIn. Check out this infographic by The Shelf for even more V-day insights. They currently serve businesses in the fashion, beauty, lifestyle, travel, food and family space. She's also the co-creator of street style blog, Streetscoutme. Valentine’s Day is almost here. Courtesy of: The Shelf.
Infographic: How Twitter affects the stock market. Why: Jim Dougherty shares an infographic that gives us a fascinating look at how tweets can have far-reaching real world consequences. Twitter Facebook Google+ LinkedIn Thursday Roundup: Twitter Tips. Based in the Washington, D.C., Wouldn''t you like to be in her kitchen?
Infographic: 25% of marketing budgets spent on content marketing. Why: Jim Dougherty doesn’t agree with the premise (and title) of this infographic, but is impressed with some of the processes detailed. Twitter Facebook Google+ LinkedIn Weekly Roundup: Marketing. Manage Your Marketing: What’s Your Story.
For example, to reach lawyers or healthcare professionals, you might focus on promoting content on LinkedIn. Repurpose existing content by updating outdated information, turning blog posts into infographics or videos, compiling related articles into an eBook, or breaking down comprehensive guides into smaller, digestible pieces.
Pull the whole idea together as an infographic or slide show to illustrate for media, especially for digital who could end up using piece as is. Take survey results and post to Twitter and LinkedIn. Try to surround a client submission with other non-competing products or services. Predictions are a perennial.
Original images, smart infographics and engaging videos certainly capture the attention of your audience and are now important Digital PR skills. Social Media at Work: LinkedIn cornered the market for business networking online. Audio & Visual: There seems to be no end to the demand for immediate, visual content.
Original images, smart infographics and engaging videos certainly capture the attention of your audience and are now important Digital PR skills. Social Media at Work: LinkedIn cornered the market for business networking online. Audio & Visual: There seems to be no end to the demand for immediate, visual content.
Original images, smart infographics and engaging videos certainly capture the attention of your audience and are now important Digital PR skills. Social Media at Work: LinkedIn cornered the market for business networking online. Audio & Visual: There seems to be no end to the demand for immediate, visual content.
How often should you post new content on LinkedIn or other online channels? I admit, when our agency first began guiding clients toward more effective use of Facebook, Twitter, Google+, Pinterest, LinkedIn and other online marketing channels – I thought all posts and links were created equal. Spark conversation with comments.
Five awesome tools to create infographics. Twitter Facebook Google+ LinkedIn Monday Roundup: The Right Business Tools. Why: If you didn’t read this post when it published not that long ago, here it is again; it covers tools that help you manage email, scheduling, social media, and more. 20 free tools to evaluate social media.
Make it Visual: The Power of InfographicsInfographics are an excellent way to transform complex financial data into engaging, visual stories - especially in investor communications. Infographics cut through the noise, offering a clear, concise, and visually appealing way to present data and strategies.
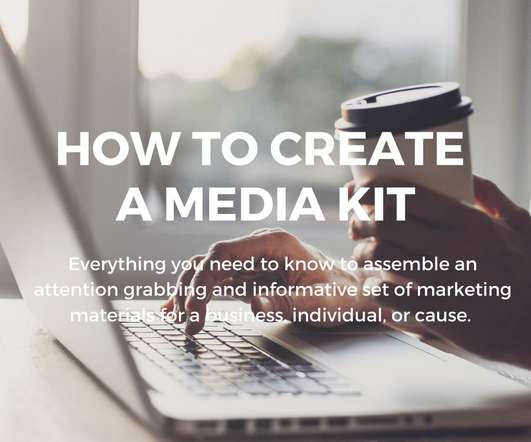
Whether the company is looking to promote its media kit on social media, feature it in a post on LinkedIn, or send a link to a content creator via Instagram DMs, it can link a media kit on any platform. Some look like resumes, using bulleted lists, while others use infographics and visuals to convey valuable information about a brand.
Infographic: How to create the perfect Facebook profile picture. Twitter Facebook Google+ LinkedIn Monday Roundup: Facebook Tips for Business. Scott Ayres offers some tips on improving your chances at earning a “share” over at the PostPlanner blog. 8 Steps To Effective Content For Social Media.
Here, social platforms like LinkedIn operate as the new arenas for generating leads and raising brand awareness. LinkedInLinkedIn stands tall as the go-to platform for B2B social media. Infographics These data visualizations can simplify complex information and present key takeaways in a clear and concise fashion.
We’re seeing movement toward allowing all employees to be the storytellers, whether it’s on LinkedIn or social media,” Purcell said. The second way to make numbers more relatable is to display them as infographics. Getting employees involved in being communicators naturally leads to engagement.” Show don’t tell.
Take a look at the marketing and PR jobs posted on sites like Indeed, Glass Door or even LinkedIn, and you’ll find these words cropping up in a large percentage of the ads. Develop, research, and write data-oriented stories, reports and infographics.
Create social videos and infographics. Create social-friendly videos and infographics. Our industry analysis found that videos and infographics outclassed other content formats in terms of average social shares. Infographics, meanwhile, saw twice as many shares as articles. (We’ll Here are our biggest takeaways.
They dig through LinkedIn and blogs for experts and sources. LinkedIn news consumers are more likely to be high earners and college educated. LinkedIn news consumers are more likely to be high earners and college educated. Twitter news consumers are significantly younger than news consumers on Facebook, Google Plus and LinkedIn.
We organize all of the trending information in your field so you don't have to. Join 48,000+ users and stay up to date on the latest articles your peers are reading.
You know about us, now we want to get to know you!
Let's personalize your content
Let's get even more personalized
We recognize your account from another site in our network, please click 'Send Email' below to continue with verifying your account and setting a password.


Let's personalize your content