This site uses cookies to improve your experience. To help us insure we adhere to various privacy regulations, please select your country/region of residence. If you do not select a country, we will assume you are from the United States. Select your Cookie Settings or view our Privacy Policy and Terms of Use.
Cookie Settings
Cookies and similar technologies are used on this website for proper function of the website, for tracking performance analytics and for marketing purposes. We and some of our third-party providers may use cookie data for various purposes. Please review the cookie settings below and choose your preference.
Used for the proper function of the website
Used for monitoring website traffic and interactions
Cookie Settings
Cookies and similar technologies are used on this website for proper function of the website, for tracking performance analytics and for marketing purposes. We and some of our third-party providers may use cookie data for various purposes. Please review the cookie settings below and choose your preference.
Strictly Necessary: Used for the proper function of the website
Performance/Analytics: Used for monitoring website traffic and interactions
According to the Cision 2017 State of the Media Report , when communicators pair compelling messages with rich formats like photos, videos, social media posts, infographics and data, they can drive better and more accurate coverage and increase earned media opportunities. RISING 2017 MEDIA TRENDS.
Upload the resulting audio or video file to your YouTube channel allows you to institutionalize it for all to see and hopefully marvel. If you do not have a YouTube channel create one. If you have quantitative data showing the result of a campaign or increased revenues link to an infographic that visually tells the story.
Infographics demonstrate your brand’s expertise in your industry. Share videos from YouTube to Facebook or Twitter. Tweet out links to you infographics to provide real information for your followers. Multimedia can come in a wide range of formats: Company logos provide a visual representation of your brand.
Infographics demonstrate your brand’s expertise in your industry. Share videos on YouTube, Facebook and Twitter. Tweet out links to infographics to provide data-driven information for your followers. Multimedia can come in a wide range of formats: Company logos provide a visual representation of your brand.
With YouTube being the top site for video (and with the benefits that come from being Google-owned to boot), brand managers and communication pros should ensure they’re taking every step to leverage this asset.
You can select research on a variety of topics, from understanding consumer behavior and mobile search to research on the new multi-screen world and YouTube insights. Once you identify a study and topics of interest, you can then take existing research and build your own infographics to showcase the information.
Check out the survey highlights in our original infographic and read more in our news release. As consumers increasingly look for relevant and engaging multimedia content, it’s no surprise that PR and marketing pros are answering the call by producing and sharing photos, video, infographics and other visual content with their audiences.
They also fill their blog and YouTube pages with educational content, company updates and industry news, which they promote via social media. Infographics can be especially useful because they explain complex topics with the use of visuals. Brainstorm Related Topics. If you use visuals, more people will see your content.
Similar to Facebook, YouTube’s “Recommended for You” section is another example of how user activity and preferences fuel content discovery. For instance, if a blog post does extremely well, you can then make a video, slideshow and an infographic to get a better momentum. Why is Content Discovery Important?
According to the Cision 2017 State of the Media Report , when communicators pair compelling messages with rich formats like photos, videos, social media posts, infographics and data, they can drive better and more accurate coverage and increase earned media opportunities.
Facebook recently reported that it receives more than 4 billion video views each day , more than YouTube. But this changing environment has upset those who rely on advertising revenue from their YouTube videos. . Taking frustration with this to the Web, YouTube star Hank Green expressed his opinions on the topic in a Medium article.
Infographics. Infographics , which visually interpret data, appeal to visual learners. If you’ve got rather dry data, turning it into an infographic is a great strategy for getting people to give a crap. If you’ve got rather dry data, turning it into an infographic is a great strategy for getting people to give a crap.
Or you can edit the same blog into an infographic or share pull quotes from the piece on social media. Is there a YouTube video that garnered thousands of organic views? Ross Simonds, a digital marketing strategist and entrepreneur, repurposed his LinkedIn blog into a YouTube video that has over 14K views. Video to blog post.
More and more, IROs are incorporating photos and video into their IR websites and using infographics to emphasize important data in their earnings reports. In particular, YouTube videos are given preferential treatment (possibly because Google owns YouTube). Playing to a visual world.
The 97-year-old co-op Land O’Lakes makes extensive use of video on its website and YouTube page, showing its values of innovation, cooperation, and service in a series spotlighting various business partners. Verizon’s Oath uses video to take the traditional case study beyond the usual infographic or blog post.
Here’s a fun infographic from the folks over at Domo about how much is happening in an Internet minute. In one minute, the equivalent of all 4 seasons of Game of Thrones is uploaded to YouTube. Earlier this year, Mark Schaefer proposed the idea of what he calls content shock. Put simply, everyone is creating content.
This could mean sharing news via a YouTube video or creating an infographic on a recent industry trend. Journalists have taken note and now almost half of them use video- and image-based content in their work regularly. Brands should follow suit and start incorporating more multimedia content in their campaigns.
Extract Data from your Content and Design an Infographic. People love infographics. So why not repurpose your written content into a well-designed and impactful infographic? An Infographic is a way of exposing your content to more readers. An infographic is 30X more likely to be read than text-based content.
Infographic: Millennials and Social Commerce. What If Warren Buffett had a YouTube Channel? If you enjoyed this post, you might also like: Infographic: Social Media Short Hand for the un-Social CMO. I’ve read and blogged about previous reports produced by the UMASS Center for Marketing Research for several years now.
Post an infographic (check out www.Fiverr.com or www.Canva.com to have on easily made). Check out this short video and remember, if you like these, subscribe to our YouTube Channel >> HERE. I want you to subscribe to the YouTube channel and like this video that way you’ll get notified every time I do these.
When the video was finally done, it was published on YouTube and embedded in emails and a product page. This reminds me of a situation years ago, when a couple of colleagues of mine lobbied successfully, to produce a product video. 97% of respondents said video content and communication were useful after making a purchase.
A search for “senior demographics social media” brought up this incredibly helpful infographic. I totally dismiss the YouTube statistics as irrelevant, because most people watch videos on YouTube without logging in, so the statistics are not an accurate snapshot of real usage for anyone, much less that specific demographic.
If 55,000 people watched your video on YouTube, I was happy. Similarly, an exceptional social media marketer thinks beyond the mechanics of posting YouTube clips, LinkedIn updates and tweets to consider two vital questions: How did the audience come to see your content - via Google or Facebook? Our clients were happy.
1) Infographic: USA Today was the first to own the infographic because snappy visuals help show the news instead of simply telling it. 6) Video File: We''re all hitting YouTube for one reason or another. If you keep trying the same thing, expecting different results, you''re nuts.
Pull the whole idea together as an infographic or slide show to illustrate for media, especially for digital who could end up using piece as is. Use video to capture the CEO forecasting the industry future for YouTube. Try to surround a client submission with other non-competing products or services. Predictions are a perennial.
A few years ago, I created the Social Media Strategy Wheel Infographic for PR professionals. The Infographic is a visual graphic broken down into different areas of focus, which are critical during the planning process. The Social Media Strategy Wheel. The wheel was designed to help you during the planning process.
Frequently over used and abused because of the perceived low cost and ease of automation Graphics – information communicated via visual design; infographics are frequently used as a visual way of presented data Podcasts and video – an audio and/or visual means of communication that is frequently educational or informational.
On Facebook, Twitter, YouTube, and all those other social networks. YouTube: How many views do they get? Cool infographics. Now, I don’t know about you, but the bin thing is maybe going a touch too far! Today, it is so much easier and it’s a lot more transparent with the advent of search engines and a social web.
For example, previous PPC ad data that shows certain taglines in ads to be more effective would be very useful for a creative team building an infographic on the same topic. Existing social media data from your Instagram, YouTube, or Facebook accounts could help to inform what imagery resonates best with your audience.
Photographs, illustrations, memes, and infographics paint a thousand stories without a single word, engaging people through color, composition, and symbolism. Movies, TV shows, and even YouTube videos offer moving experiences, immersing the public in fictional worlds or showcasing the beauty of reality.
Incredible data: After Google and YouTube, Twitter is the next most popular search engine. We talked about it in our recent social trolls infographic , and we were stoked to hear Guy Kawasaki confirm best practices for dealing with social media detractors. nealschaffer #SMMW16. Cision (@Cision) April 18, 2016. Trolls vs. Your Brand.
YouTube is the second largest search behind Google, and Statista found that 95% of viewers are more likely to remember a CTA after watching a video, compared to 10% when reading it in text format. In our infographic, we examine if TikTok is the next big thing in video marketing. One of these platforms was TikTok. Until next time!
Video, infographics, images and – yes, even blogs – each have their particular advantages, but they’re more powerful when combined into a multi-faceted experience. Infographics use data and images to drive storytelling for a richer viewer experience. Still not convinced?
Videos, photos, infographics, charts…they are everywhere. But there are a couple times a day when we stumble upon a must watch video on YouTube like “ Great White Shark Surfing ” or, some awkwardly “wrong” video with Louis CK, or, for those of you more enlightened something more educational. You’ll get there. (Or
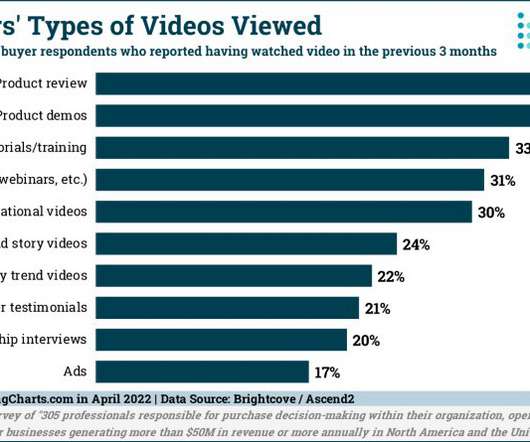
Create social videos and infographics. Create social-friendly videos and infographics. Our industry analysis found that videos and infographics outclassed other content formats in terms of average social shares. Infographics, meanwhile, saw twice as many shares as articles. (We’ll Here are our biggest takeaways.
Newsletters, video, infographics and white papers were also named, along with case studies, webinars and tip sheets. Twitter (75%), Facebook (73%) and LinkedIn (63%) are the most commonly used social channels for sharing visual content (video, photos, and infographics). PR professionals, be prepared.
https://www.thinkwithgoogle.com/infographics/for-football-fans-its-more-than-just-a-game.html. “The The Big Game Becomes a Month-Long, Multi-Screen Event on YouTube”. https://www.thinkwithgoogle.com/articles/youtube-insights-stats-data-trends-vol9.html. “For Football Fans, It’s More Than Just a Game”.
Facebook today hosts more video views than YouTube does. How-to videos, video testimonials from existing customers, infographics about industry trends, and even inspirational quotes set against picturesque background images are fair game for a more exciting social media presence. Give your users content that they enjoy on social media.
Infographic. And, while infographics have had more of the spotlight recently with digital media, they’ve been used for years. National Geographic even has a book to share their use of infographics over the past several decades. National Geographic even has a book to share their use of infographics over the past several decades.
There are influencers on Twitter, Vine, YouTube, Pinterest and Instagram. Infographics. In Traditional PR we’re conditioned to view the media and academics and authors as thought-leaders. Digital PR opens up a much broader pool of influencers to work with. Many bloggers have huge audiences and can sway their readers. Blog Posts.
There are influencers on Twitter, Vine, YouTube, Pinterest and Instagram. Infographics. In Traditional PR we’re conditioned to view the media and academics and authors as thought-leaders. Digital PR opens up a much broader pool of influencers to work with. Many bloggers have huge audiences and can sway their readers. Blog Posts.
There are influencers on Twitter, Vine, YouTube, Pinterest and Instagram. Infographics. In Traditional PR we’re conditioned to view the media and academics and authors as thought-leaders. Digital PR opens up a much broader pool of influencers to work with. Many bloggers have huge audiences and can sway their readers. Blog Posts.
Platforms like Facebook and YouTube will continue to be effective since they have the top two numbers of social media users worldwide. Meta’s Reels are viewed 200 billion times a day and YouTube Shorts are the trend to watch in 2024. In particular, short form videos are booming in PR trends.
Fortunately, the folks at Prohibition PR put together this handy cheat sheet for handling rich media on everything from the usual suspects (Facebook, Twitter, LinkedIn and YouTube) to more recent additions such as Snapchat and Vine. Bookmark and enjoy! Courtesy of: Prohibition PR.
We organize all of the trending information in your field so you don't have to. Join 48,000+ users and stay up to date on the latest articles your peers are reading.
You know about us, now we want to get to know you!
Let's personalize your content
Let's get even more personalized
We recognize your account from another site in our network, please click 'Send Email' below to continue with verifying your account and setting a password.


Let's personalize your content