This site uses cookies to improve your experience. To help us insure we adhere to various privacy regulations, please select your country/region of residence. If you do not select a country, we will assume you are from the United States. Select your Cookie Settings or view our Privacy Policy and Terms of Use.
Cookie Settings
Cookies and similar technologies are used on this website for proper function of the website, for tracking performance analytics and for marketing purposes. We and some of our third-party providers may use cookie data for various purposes. Please review the cookie settings below and choose your preference.
Used for the proper function of the website
Used for monitoring website traffic and interactions
Cookie Settings
Cookies and similar technologies are used on this website for proper function of the website, for tracking performance analytics and for marketing purposes. We and some of our third-party providers may use cookie data for various purposes. Please review the cookie settings below and choose your preference.
Strictly Necessary: Used for the proper function of the website
Performance/Analytics: Used for monitoring website traffic and interactions
A Guest Post By Shayla Costa, UMASS at Amherst Student, Winner of the PR Expanded Infographic Contest. An assignment in my Principles of Public Relations class with Professor Jennie Donohue was to read Deirdre Breakenridge’s new book Answers for Modern Communicators and create an infographic based on one of four concepts.
I’ll beg Dr. Barnes to forgive me the editorial liberty I’ve taken with this headline, but that’s my takeaway after finally reading the UMASS Dartmouth Study: The 2014 Fortune 500 and Social Media: LinkedIn Dominates As Use of Newer Tools Explodes. The study, an annual affair every year since 2008, was published this past August.
Before the students dive into the model and the study findings, I’m quick to point out that the road to FEEL (facing Fears , engaging with Empathy , living with Ethics and unleashing Love ) starts early and long before you begin your professional career. .
Two recent studies by Elite Daily and CrowdTwist found that millennials, in particular, are extremely loyal to their chosen brands — especially those that are more engaging on social media. In addition to social media, one way brands have enabled that direct, personal connection with consumers is through a company blog (hey, like this one!).
Faculty might have students create blogs, use a course learning software’s discussions, or even create a Facebook Group. One way I do this is by having students create infographics around a given topic. For example, in one class I had them create an infographic about the four-step PR campaign process.
The most effective multimedia elements include: Product demonstration videos Infographics highlighting key data points High-resolution product images Interactive charts and graphs Downloadable media kits Social media-ready visual assets Companies like Samsung exemplify this multimedia approach.
Case studies. Case studies are a great customer reference and sales tool for any growing company. For PR teams, case studies can be very useful for joint media briefings, award submissions and trade media placement. They may find their way into the occasional short blog post for the company site.
Creating a fintech case study can feel like a never-ending trip to the DMV. While a fintech case study isn’t as straightforward to create as other types of content , these powerhouse stories offer unparalleled value for brands. But that’s exactly why a well-crafted fintech case study can be so powerful.
Blog Posts. Yes, I’m talking about blogging. Blogging is no longer an experimental trend that might be a waste of time. No, there is overwhelming evidence that shows maintaining a blog yields business results. Brands who blog have more indexed web pages, which boosts SEO. Infographics. You’re doing it.
Blog Content Creation. There is overwhelming evidence that shows maintaining a blog generates business results. Your blog authenticates your brand’s personality, expertise and values. An active blog boosts traffic, SEO, drives leads and yields 97 percent more inbound links. Infographics. Case Studies.
Being on the go means you can be anywhere and have an idea for a blog post or want to brainstorm on a topic. Every week, I use Evernote for creating blog posts and interview responses; recording the articles and the answers to questions. You can even customize the dimensions of your graphics.
Check out the survey highlights in our original infographic and read more in our news release. As consumers increasingly look for relevant and engaging multimedia content, it’s no surprise that PR and marketing pros are answering the call by producing and sharing photos, video, infographics and other visual content with their audiences.
The first thing most ambitious marketers do when beginning their marketing adventure is to plan the tactics and choose the forms of the content they want to publish (blogs, videos, podcasts, infographics, etc.). For example, blogging can be a huge time commitment. Keeping Content Engaging. Measuring Content Effectiveness.
Infographics remain high on the marketing list of tactics. This week I looked at Google search data for the word “infographic” (and variations) and found interest continues to grow at a steady pace. We see infographics in content marketing survey results as well. But Those Troubled Infographics. 1) Data visualization.
Integrating Storytelling Across PR, Blogs, and Branded Content Public relations and content marketing share a common foundation: storytelling that connects with audiences and builds lasting relationships. According to a study by Cision, 91% of PR professionals believe content marketing is becoming more important to their success.
Develop a company blog that showcases your expertise and provides real value to readers. Focus on truly newsworthy announcements and include multimedia elements like images, videos, and infographics that make your story more shareable. Press releases still matter but require a modern approach.
” It occurred to me that some people treat infographics like my three-year old treats “Starships.” One recent infographic illustrated this point quite well. The problem with this is that this is simply one case study. Consider this infographic that I created. How Do You Like Them (Infographic) Apples?
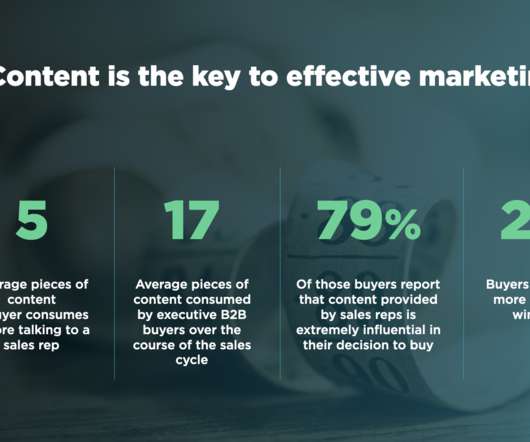
Ads pop up and disappear, while blog posts, news articles, and white papers stay searchable for months ie even years. In 2017, Forbes reported : “Most B2B buyers say they rely heavily on white papers (82%), webinars (78%), and case studies (73%) to make purchasing decisions.
Journalists look for pitches that are backed up by data in the form of charts, graphs, tables, or interactive infographics. Infographic from a 2017 article in MarTech Advisor. Infographics also offer SEO opportunities for both the news outlet and the sponsor. 5 reasons to embrace data-driven PR.
So whilst thinking about what formats can work best, try to avoid saying “I want to create an infographic” or “I want to create a video”. Personally, I found this somewhat surprising because generally, you see very few examples of this format shared by the SEO community at conferences, in case studies or on Twitter. Let’s get into it.
It was a similar presentation to the one I gave at the Fort Worth PRSA meeting in October (I shortened and updated the deck with a bunch of new examples and case studies). I’ve blogged about Microsoft Stories before , but I’m a big fan. Don’t: Talk about events only you care about. Very few people cares. #6:
Here’s a look at statistics across PR, marketing, and social media that were surfaced in the various reports and studies covered on this blog throughout 2020. Many of the blog posts published here are based on survey research, analytical studies or other sources of data. Source: 3 Studies Branding and Marketing ).
Obviously items like viral videos or viral articles will do the trick, but infographics and other forms of visual content are also a great way to stimulate sharing. A recent study found that infographics are shared 3x more often than any other visual item. Ask questions, study brands in your niche, and be persistent.
A robust content marketing strategy involves a mix of valuable content: articles, blogs, case studies, infographics, podcasts, webinars, videos. This content is considered “valuable” because it has been carefully crafted. The post How to Secure Your SEO and Content Marketing Sweet Spot appeared first on Stern Strategy Group.
However, the same study revealed that only a measly 17 percent of content marketers report their content marketing efforts as much more successful. The study found that the longer the content the better. Practically every study that analyzed content length and performance came to the conclusion that longer is better. List posts.
Visual storytelling through infographics, videos, and interactive content helps break down complex concepts. Per studies, only 54% of Americans trust the technology sector, down from 78% in 2012. The post How PR Can Bridge the Gap Between Defense Tech and the Public appeared first on Public Relations Blog | 5W PR Agency | PR Firm.
If you want to experiment with content, copy or messages, it’s easy to do that with a blog post. Assuming you publish consistently if one blog post flops, the impact is negligible, and you learn quickly how to adapt or modify the message before you spend any more. By contrast, video is harder to experiment with in that way.
Something similar has happened in content marketing and blogging in the marketing community. Keep in mind if the length of content matters, as this study suggests, the listicle posts must have depth and quality. The study found, “36% of articles with H2+H3 tags have higher performance in terms of traffic, shares, and backlinks.”
You can check out their original conversation about product-led digital PR on their blog. link] Cyrus Shepard’s Internal Linking Study : An in-depth analysis of internal linking strategies and their impact on SEO. Main Takeaways Here is the TL:DR recap of the conversation. Vince: Yeah. Do you have to be a specific size?
This topic is a very controversial one, with blogging experts torn between the two. However, thanks to Hubspot’s extensive study of 13,500 content marketers, the verdict is in : they found that the sweet spot for content frequency is 16 posts a month; publishing 16 or more articles monthly will lead to 3.5 They are: Infographics.
If your KPI is blog content views, you could create an article about why environmentally-friendly ingredients are also beneficial for your skin. Study your audience It’s time to dig deep and learn about your customers. Content distribution channels can be divided into owned channels (website/blog, email newsletters, social media, etc.),
Developing and maintaining a blog is an excellent way for executives to establish relationships and engage with industry thought leaders. For this reason, PR professionals are converting their media publications into blogs and e-newsletters. White papers, webinars, infographics, and case studies are also widely used.
Media love poll-results story pitches, especially when accompanied by visuals like infographics. You can cherry-pick studies from different sources, combine and cross-reference to yield an original piece of secondary research – and a story. Whatever the outcome, it’s likely to yield fascinating material for content.
Now, imagine how awful it’d seem if after spending so much time and resources on a blog post, you let it waste away in some archive folder—It doesn’t make sense. The truth is that your best articles and blog posts can find a new life in an entirely different form. Assemble your Popular Blog Posts into an Informative Ebook.
Make case studies more visual. 77% of B2B buyers in the evaluation stage say that case studies are the most influential content they see from companies. Verizon’s Oath uses video to take the traditional case study beyond the usual infographic or blog post.
You can find out what they do behind the scenes if you look for case studies (do a search for “case studies for company ’x’”) that take a deep dive into their innovative tactics. Also take a tour of their websites and blogs. Do they have a blog? Case Study in Innovation Outside a Niche.
People were creating more webinars and livestreams , publishing research reports, investing in better blog content to build their newsletter lists and nurture prospects. When I say “content,” I’m not just talking about top-funnel blog posts or infographics. Case studies that make you imagine new possibilities.
As regular readers know, I often pour over marketing studies on these pages and sometimes produce survey cliff notes stemming from multiple reports. That brings us to content marketing and the adjacent reference to lead generation in this study, which I think can be confusing. Blog post: 44%. What gets credit for a sale?
A 2014 study of more than 72,000 Facebook pages shows that visuals, including video and photos, generate the highest levels of engagement among users. Think about how many times you’ve seen a text-based article go viral – and compare that to cute kitten photos, the ALS Ice Bucket Challenge or infographics. Images inspire sharing.
Two recent studies by Elite Daily and CrowdTwist found that millennials, in particular, are extremely loyal to their chosen brands — especially those that are more engaging on social media. In addition to social media, one way brands have enabled that direct, personal connection with consumers is through a company blog (hey, like this one!).
According to a study by DemadnWave whitepapers, case studies, videos and infographics work well. “Even though B2B marketers recognize materials such as research reports, blogs and videos are effective, producing them is another matter entirely. Cusotomer engagement. type insights.
For example, you can write one blog post and summarize the critical elements for a Twitter thread. Or you can edit the same blog into an infographic or share pull quotes from the piece on social media. Content repurposing isn’t as simple as copy-and-pasting your blog’s highlights to your social media.
Today, having a blog isn’t just a nice-to-have for your page or website. Here, we’ll be delving into why blogging is the tool your business needs, as well as some tips on how to write an attention-grabbing blog to consolidate your content marketing strategy. Why do I need a blog? What do they want to know?
For example, I found this great study on food delivery trends based on proprietary data from GrubHub. Most of their infographics only cost 1 credit, which is $345. (It Many are perfect for a city study type post, which Jodie Booras outlined in our city study post. Can we study how long these resolutions last?
We organize all of the trending information in your field so you don't have to. Join 48,000+ users and stay up to date on the latest articles your peers are reading.
You know about us, now we want to get to know you!
Let's personalize your content
Let's get even more personalized
We recognize your account from another site in our network, please click 'Send Email' below to continue with verifying your account and setting a password.


Let's personalize your content