This site uses cookies to improve your experience. To help us insure we adhere to various privacy regulations, please select your country/region of residence. If you do not select a country, we will assume you are from the United States. Select your Cookie Settings or view our Privacy Policy and Terms of Use.
Cookie Settings
Cookies and similar technologies are used on this website for proper function of the website, for tracking performance analytics and for marketing purposes. We and some of our third-party providers may use cookie data for various purposes. Please review the cookie settings below and choose your preference.
Used for the proper function of the website
Used for monitoring website traffic and interactions
Cookie Settings
Cookies and similar technologies are used on this website for proper function of the website, for tracking performance analytics and for marketing purposes. We and some of our third-party providers may use cookie data for various purposes. Please review the cookie settings below and choose your preference.
Strictly Necessary: Used for the proper function of the website
Performance/Analytics: Used for monitoring website traffic and interactions
What you see on Instagram, Facebook, Twitter, or any platform does not always give you a clear picture of someone’s life, what is going on in their world or how they are truly feeling. The data you collect and analyze on social media is based on what people want to share with you, and how they want to be seen.
One way I do this is by having students create infographics around a given topic. For example, in one class I had them create an infographic about the four-step PR campaign process. I loved seeing students tweet and share their infographics after class, just in case “new PR students” needed any help.
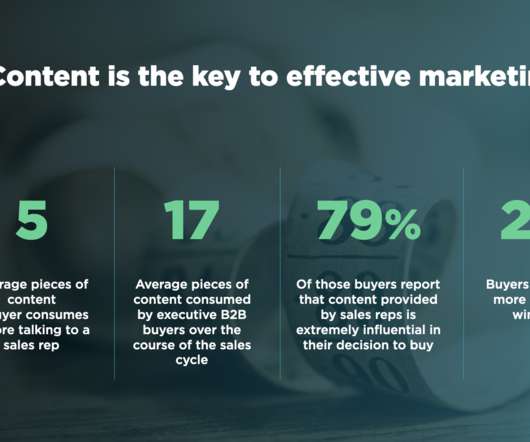
Check out the survey highlights in our original infographic and read more in our news release. As consumers increasingly look for relevant and engaging multimedia content, it’s no surprise that PR and marketing pros are answering the call by producing and sharing photos, video, infographics and other visual content with their audiences.
This continues to be evident on Instagram, where companies can share in-feed posts, stories or Reels to great effect. Here, we explore how companies can effectively connect with target audiences on Instagram. One of the best product updates for companies that Instagram has rolled out in recent years is shoppable content.
Everyone is buzzing about Instagram and Pinterest – but are they worth building an audience there? A search for “senior demographics social media” brought up this incredibly helpful infographic. It turns out that TWO PERCENT of seniors use Instagram. Do seniors use them? Used with permission from Heidi Cohen.
Engage with the audience on platforms like Instagram, Facebook, and TikTok through targeted advertising, contests, and influencer partnerships. Create valuable content, such as blog posts, videos, and infographics, to educate and inform the target audience.
Instagram recently released Instagram Stories, a feature that is very similar to Snapchat. This helpful infographic from MarketingProfs provides a useful illustration of the two to help you decide which is best for your needs.
So, by designing a comprehensive content marketing strategy that includes search marketing, Facebook marketing, Twitter marketing, Instagram marketing, etc., For instance, if a blog post does extremely well, you can then make a video, slideshow and an infographic to get a better momentum. you can benefit a lot. Offer Variety.
Short-form videos, infographics, and interactive polls help break down complex betting concepts into digestible pieces. This content strategy works particularly well on platforms like Twitter and Instagram, where esports fans already actively engage with gaming content.
In a world where more than 500 million of us are posting nearly 100 million photos and videos on Instagram every day, it goes without saying that visuals are a necessity on social media. Whether simple stock imagery or detailed infographics, visual content makes […].
That’s according to a survey of 1,200 “social dads” by Social Media Link and presented in the infographic – Dads Do Social – published nearby. In an introduction to the infographic, marketing director Jordon Ben writes: “Today’s dads are social, vocal and see their online world as a communal resource to help them make decisions.
The Stories feature implemented by social networks like Facebook, Snapchat, and Instagram represents a great communication channel for businesses, particularly suited to those which already post high-quality images and videos across their social media channels. Why is Instagram Stories Feature Important? Infographic via 99firms.com.
Her firm still gets major website traffic from an infographic they posted over two years ago. What happens to an infographic you posted to Facebook even two days ago? Instagram is also another great social network to consider. Also people on Instagram are more engaged with content, a perfect way to discover a new audience.
Instagram is more than mouthwatering food photos and lusty travel pictures, it can be a powerful business tool for solo PR pros. Instagram has over 800 million users and 25 million business profiles. The addition of Instagram stories drove a 13.1% The infographic below provides a quick an easy guide to instagram ads.
Another easy way to take a blog post or other content to the next level is by creating an infographic with help from a site like Picktochart or Venngage. Don’t underestimate infographics – they remain a powerful way to present large amounts of information in an easy to digest way. DesignerPics. Haute Chocolate.
Summarise your company’s year in an infographic which can be used: during staff meetings to thank everyone for their contribution. Here’s a short list of Christmas tactics you might want to roll out like a sleigh: Find a charity for your organisation to support this Christmas season (which may be in addition to charities you already support).
Think about most of the people that follow you on Facebook, Twitter, Instagram and any other social network. and I broke this large infographic into many Facebook posts, ads and posters we used for months afterward. Don’t: Try to become the next Oreo. Please, God. I’m begging you. #4:
Don’t neglect the basic plot; exposition, rising action, climax, falling action and resolution can play a role in designing a visual story or an asset like an infographic. In the case of an infographic, you can use different design principles for different effects. They also can be broken so as to emphasize a key point.
Rogue Magazine recently launched their Spring Issue and their Instagram account is populated with exclusive images from their articles, a behind-the-scenes video from one of their cover shoots, and a photo of the new issue on newsstands. Infographics are your key language elements here. See the example below.
Is your brand’s Instagram stalled at a few thousand followers? It was created with Instagram in mind but can be applied to any social platform. Consulting journalists and PR pros have helped the company create a guide that includes headlines, story angles and ideas for infographics that appeal to media. Jump on now.
When I say “content,” I’m not just talking about top-funnel blog posts or infographics. Product videos that stop you in your tracks as you scroll LinkedIn and Instagram. According to LinkedIn, a whopping 78 percent of marketers expect to increase their content budget next year.
Instagram is more than mouthwatering photos of food and beautiful sun-kissed people with envious abs. In addition to the news feeds, Instagram Stories have exploded in popularity. While this social channel is tailor-made for naturally visual businesses, your client does not have to be a B2C business to benefit from Instagram stories.
Here’s a fun infographic from the folks over at Domo about how much is happening in an Internet minute. In one minute, 216,000 new photos are added to Instagram. Put simply, everyone is creating content. Lots and lots of content. In one minute, the equivalent of all 4 seasons of Game of Thrones is uploaded to YouTube.
You’d pay for a photo shoot or an infographic or a video production, right? But when my brain needs a rest, I head over to Instagram for all the pretty pictures. Lastly, of course established influencers should be paid for their work. They likely have day jobs and are spending time on generating content for you.
Include your logo in infographics, social media posts or any other content that has the potential to be shared by others. . An Instagram post size is typically different from a Twitter post size. Make your content identifiable by sticking to one or two font types for all your content. Evoke Visual Clarity. White Space is Visual Gold.
We know hashtags can corral conversations, help you find people you didn’t know existed and generally improve our Twitter (and Instagram) experience. Below: an infographic capturing the #socadl (social media conversations in Adelaide) hashtag, using Visual.ly. There’s an art to hashtags on Twitter.
For example, you could hold a Twitter Q&A session prior to the event or post short video introductions on Facebook and Instagram. Include multimedia, like videos or infographics, that reporters can reference in their stories, before or after your conference takes place. Want to take it one step further?
More recent outcry surfaced in response to Richard Prince’s New Portraits series where he added emoticons and comments to original Instagram posts and put the results on display. Media outlets aren’t pointing towards fair use to defend the use of other’s material.
Infographic? Off BuzzFeed creates short content for Vine, Tumblr, Instagram and Snapchat. This post was inspired by our free “ Outside-The-Box Content Marketing for PR ” white paper. How do you stand out with content? With so much competition for people’s attention, that won’t always work.
But doesn’t most of this data we’re seeing imply that our customers and targets want to consume: videos, photos, infographics and short messages (via private messaging apps)? You’re already starting to see this on visual-first platforms like Instagram. White papers. Longer-form text-based content.
If you publish a study, you can turn it into an infographic and video spotlights. You can pull interesting stats and develop tweets or visual content for Instagram or Pinterest. Millipedes are one of the creepiest bugs on the face of the planet, but it’s helpful to think of your content in terms of them.
Pull the whole idea together as an infographic or slide show to illustrate for media, especially for digital who could end up using piece as is. Get some great shots of that “feel-good” story or some colorful tips and post to Instagram. Try to surround a client submission with other non-competing products or services.
A few years ago, I created the Social Media Strategy Wheel Infographic for PR professionals. The Infographic is a visual graphic broken down into different areas of focus, which are critical during the planning process. The Social Media Strategy Wheel. The wheel was designed to help you during the planning process.
Whether the company is looking to promote its media kit on social media, feature it in a post on LinkedIn, or send a link to a content creator via Instagram DMs, it can link a media kit on any platform. Some look like resumes, using bulleted lists, while others use infographics and visuals to convey valuable information about a brand.
On the other hand, visual content works well on Pinterest and Instagram , with photos, infographics, and even videos being able to generate a lot of website traffic for many businesses.
Joy Miles ( @lunchesandlittles ) is a food influencer with an incredibly innovative and unique Instagram profile. UnifiedSocial.com offers this great infographic on driving social success via mobile. Instagram: [link]. 5 – Get Creative. Getting (and staying) creative can be difficult. comScore 2016 U.S. Twitter: [link].
Or you can edit the same blog into an infographic or share pull quotes from the piece on social media. Repurpose it into an interesting Twitter or Reddit thread, LinkedIn post , or Instagram carousel. For example, Semrush repackaged its social media checklist blog post into an infographic and published it on Social Media Today.
” Instagram: How many followers do they have? Cool infographics. They also built loyal followers and advocates on Instagram, Twitter, and Facebook. Twitter: How many followers do they have? How many retweets do they get? Do they use visual tweets and hashtags? Are they using Twitter for “calls to action?”
For example, previous PPC ad data that shows certain taglines in ads to be more effective would be very useful for a creative team building an infographic on the same topic. Existing social media data from your Instagram, YouTube, or Facebook accounts could help to inform what imagery resonates best with your audience.
For more inspiration, check out this brand archetypes infographic from Printsome. Before you start creating content, find out how these mothers speak to each other on Facebook, X, TikTok, and Instagram. And Southwest’s casual and approachable vibe puts everyone at ease. It categorizes household name brands into different archetypes.
It’s no wonder that Instagram now boasts over 800 million users. In PR, this translates into everything from the well-designed event invitation to catchy infographics and visually appealing reports and studies. Much of PR work today relies on the visual to attract interest.
A study by Backlinko examining 912 million blog posts found that “list posts get an average of 218% more shares than how to’ posts and 203% more shares than infographics.”. Video performs best on Instagram. “A List posts earn more shares. Source: 4 Studies Show the Power of Long-Form Content ). Survey says put datelines on your blog.
Creative colleagues at Verve Search decided to look into the ‘most Instagrammed filming locations’ for a gambling client. Infographics. The Cambridge Dictionary defines an Infographic as, ‘A picture or diagram or a group of pictures or diagrams showing or explaining information’. Interactive Campaigns.
Experiment with diverse formats like infographics, videos, podcasts , or even interactive elements. Be it Facebook, Twitter, Instagram, LinkedIn, or a niche platform, make the brand’s presence felt and actively engage in dialogue with the followers. Don’t be monotonous Don’t limit the brand to text-based content.
We organize all of the trending information in your field so you don't have to. Join 48,000+ users and stay up to date on the latest articles your peers are reading.
You know about us, now we want to get to know you!
Let's personalize your content
Let's get even more personalized
We recognize your account from another site in our network, please click 'Send Email' below to continue with verifying your account and setting a password.


Let's personalize your content