This site uses cookies to improve your experience. To help us insure we adhere to various privacy regulations, please select your country/region of residence. If you do not select a country, we will assume you are from the United States. Select your Cookie Settings or view our Privacy Policy and Terms of Use.
Cookie Settings
Cookies and similar technologies are used on this website for proper function of the website, for tracking performance analytics and for marketing purposes. We and some of our third-party providers may use cookie data for various purposes. Please review the cookie settings below and choose your preference.
Used for the proper function of the website
Used for monitoring website traffic and interactions
Cookie Settings
Cookies and similar technologies are used on this website for proper function of the website, for tracking performance analytics and for marketing purposes. We and some of our third-party providers may use cookie data for various purposes. Please review the cookie settings below and choose your preference.
Strictly Necessary: Used for the proper function of the website
Performance/Analytics: Used for monitoring website traffic and interactions
A Guest Post By Shayla Costa, UMASS at Amherst Student, Winner of the PR Expanded Infographic Contest. An assignment in my Principles of Public Relations class with Professor Jennie Donohue was to read Deirdre Breakenridge’s new book Answers for Modern Communicators and create an infographic based on one of four concepts.
They train internal staff and external organizations on best practices for increasing visibility of online content. . The post [INFOGRAPHIC] How to Optimize Your Content for Search, in 12 Steps appeared first on Cision.
The most effective multimedia elements include: Product demonstration videos Infographics highlighting key data points High-resolution product images Interactive charts and graphs Downloadable media kits Social media-ready visual assets Companies like Samsung exemplify this multimedia approach.
Once you identify a study and topics of interest, you can then take existing research and build your own infographics to showcase the information. Yellowdig is an internal collaboration tool. I discovered. It’s free for educators who want to bring the resource into their college classrooms.
We use it in inbound marketing, we use it in inbound PR , we use it in internal communication, we use it any time we need to interact with an audience. I learned this from a very cool infographic from my friends over at PointVisible that I want to show you today. Content has become a business asset.
There’s often the opportunity to package existing internal data, which can offer an opportunity for PR teams to convey expertise or make news. By packaging it into creative infographics, PR teams can gain additional legs for data that would otherwise go unused or underleveraged.
I have worked in PR both on the client side and as the internal PR generator (primarily through content marketing).”. It’s all about quality- quality writing, well-produced videos and infographics, and, more than ever, creating immersive, multimedia content experiences. In terms of getting noticed?
The PRSA 2016 International Conference in Indianapolis brought together some of today’s top thought leaders in the field of communication– and then some. Top sponsored #content trends: infographics are not dead, humor is big in #B2B & employees are the new “native” voice – @bigal123 #PRSAICON. —
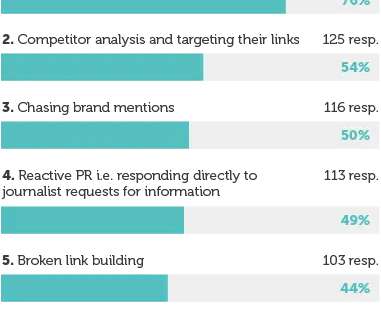
It’s great that you used proper H1 headers, implemented powerful keywords, and sprinkled in a few internal links. Obviously items like viral videos or viral articles will do the trick, but infographics and other forms of visual content are also a great way to stimulate sharing. Which content types receive the most attention?
Short-form videos, infographics, and interactive polls help break down complex betting concepts into digestible pieces. The International, League of Legends World Championship, and other premier events attract millions of viewers, creating natural promotional windows.
PR now incorporates video content and online visuals (like infographics) to drive brand narrative and reinforce marketing messages throughout the customer lifecycle. PR is now being fueled by the omnipresence of digital content. The three most important drivers are social listening, digital storytelling and real time marketing. ” 4.
So whilst thinking about what formats can work best, try to avoid saying “I want to create an infographic” or “I want to create a video”. This is often easier than updating a more complex execution such as an interactive infographic because it is usually a case of updating copy and visuals with new ones. Static infographic.
Visual storytelling through infographics, videos, and interactive content helps break down complex concepts. According to the Stockholm International Peace Research Institute, global military spending reached $2.1 These relationships require careful communication management and strategic messaging. trillion in 2021.
I'm also fascinated by leadership so when I stumbled upon this HBR research on what leadership looks like in different cultures during an online course on International Project Management , I had to dig deeper into it and decided to summarise my learnings in the below infographic.
Through September 2017, Miami International Airport was dealing with Hurricane Irma, which severely affected the airport's operations. The recognition of Miami International Airport was long due even before it responded to the Irma crisis. On November 7, Miami International Airport was named the recipient of the Peggy G.
While you can make your content discoverable by using search bars, internal links and a content recommendation engine; strategic organization helps users find the most relevant content quickly and easily. For instance, if a blog post does extremely well, you can then make a video, slideshow and an infographic to get a better momentum.
They pick up on brand messaging faster if they can see internal discussions. On the other hand, if you have a directory of standout articles, infographics, white papers , and case studies to choose from, they’ll have an easier time seeing things your way. In other cases, the part-time creators are confined to certain channels.
3) The CMO Council infographic on CMO priorities. b) “ Overcoming obstacles to marketing technology deployment – expediting digital transformation by addressing internal skills, competencies and change readiness, as well as data cleanliness and quality.”. 60% plan to run regular internal training and development programs.
Emerald Publishing is a global publisher that aims to make a real impact in the academic sectors that they operate, and we were tasked with launching a campaign in honour of International Women’s Day that celebrated women in academia who are often battling against a lack of equality and old-fashioned systems.
Video also works well as an internal tool for company announcements or simply to show accessibility, as Intuit CEO Brad Smith does in his “ new employee welcome message.” Internal communications teams use video to convey a corporate culture. A personalized way to attract talent. Make case studies more visual.
Infographic: Step Up—Or Step Back Practice symbolic pacing in your communicative leadership. Watch for sensitive inflexion points—perhaps a challenging client situation or an internal conflict—and then step forward decisively. Step Up—Or Step Back (Infographic) Symbolic pacing in communicative leadership. Thanks for reading.
Harrison Kratz shared an interesting infographic with me the other day, which I wanted to share with you. the first time I heard about International Women’s Day ; I was probably 7 or 8 years old. Women need to understand their strengths and how to leverage what they don’t know as their greatest assets. I remember.
I began blogging in 2012 while I was still a student with a couple of important goals in mind: learn how to write better as I wanted to pursue a career in PR but was studying International Business, and share all the knowledge I was gathering with the world so that I can help others and by doing so, build an audience.
Emerald Publishing is a global publisher that aims to make a real impact in the academic sectors that they operate, and we were tasked with launching a campaign in honour of International Women’s Day that celebrated women in academia who are often battling against a lack of equality and old-fashioned systems.
link] Positional : A tool that offers features for optimizing internal linking structures for SEO (and much more). link] Cyrus Shepard’s Internal Linking Study : An in-depth analysis of internal linking strategies and their impact on SEO. Sadly, I don’t think my video about infographics pitching will hold up anymore.
As some Twitter friends helped me to find: “It is a basic marketing principle that it takes seven ‘touches’ before someone will internalize and/or act upon your call to action” (source: [link] ). Below: an infographic capturing the #socadl (social media conversations in Adelaide) hashtag, using Visual.ly.
Developing a concrete plan for what happens after you publish means identifying the right internal stakeholders to start the distribution process. That doesn’t mean you should blow up every internal communications channel with every single content asset you create. Execute a larger internal communications plan.
Over the past few years the lines have blurred between affiliate marketing, internal communications, content strategy and earned media. Decisions need to be made in advance of creating content: Ask yourself if there are internal resources internal available to develop the content and determine a budget for creative executions.
A few years ago, I created the Social Media Strategy Wheel Infographic for PR professionals. The Infographic is a visual graphic broken down into different areas of focus, which are critical during the planning process. The Social Media Strategy Wheel. The wheel was designed to help you during the planning process.
Original images, smart infographics and engaging videos certainly capture the attention of your audience and are now important Digital PR skills. There are other apps making headway for internal comms – like Slack, which already has a large user base and has been valued at $1 Billion. Then we have live-streaming video.
Original images, smart infographics and engaging videos certainly capture the attention of your audience and are now important Digital PR skills. There are other apps making headway for internal comms – like Slack, which already has a large user base and has been valued at $1 Billion. Then we have live-streaming video.
Original images, smart infographics and engaging videos certainly capture the attention of your audience and are now important Digital PR skills. There are other apps making headway for internal comms – like Slack, which already has a large user base and has been valued at $1 Billion. Then we have live-streaming video.
Include additional content types alongside thes – like infographics and slide presentations – and that number hits a staggering 77% more views. It takes seven impressions or “touches” for a person to internalize the information presented and associate it with your brand. To learn more, check out this infographic on infographics.
With the COVID-19 pandemic disrupting operations within the healthcare industry, it’s crucial for healthcare communication pros to develop and implement unique internal healthcare communication strategies. 4 internal communications strategies for healthcare PR. #1. Assess lessons for the company’s internal communication plan.
Not only for body copy, but also for photography, infographics and video captions Make sure images -whenever possible- are market specific For more tips: download the whitepaper Essentials of a Stellar Newsroom. How to Optimize your Newsroom for International Audiences Part 3 of 6. Make or buy?
The senior manager should be involved in regular internal account reviews to ensure that work product conforms to program strategy and that materials and service levels are of high quality. In PR, this translates into everything from the well-designed event invitation to catchy infographics and visually appealing reports and studies.
For example: Multimedia content: Videos, infographics, podcast An estimated 3.63 From there, the spokes are pieces of creative content that expand upon ideas within the core asset, such as short video clips on social media, a blog post, or an infographic. billion people worldwide will watch digital video content in 2023.
How to use (and get) first-party data Start off by surveying the community , the users, analyzing internal product data (always remember about confidentiality), and turn them into compelling stories. For example, if you're in the health niche, an infographic on what to eat and what to avoid may work better than an article.
The industry benchmark statistics in the first part of the report came from an internal dataset of 86,270 pieces of content across all industries, measured by Contently’s content marketing platform. Create social videos and infographics. Create social-friendly videos and infographics. Report Methodology.
An infographic is included that shows how Cision Impact builds on the Cision Communications Cloud ® , to deliver the most complete PR workflow platform — from identifying influencers to reporting revenue generated. . The infographic below breaks down the five key steps to comprehensively manage earned media programs.
Results from a 2014 survey by Honeywell International that appeared in the Washington Times indicated that roughly one in five travelers switch from their preferred airline carrier to one that offers better Wi-Fi. Read the full-length white paper or check out the infographic below! . – TripAdvisor.com, May 29, 2015.
They pick up on brand messaging faster if they can see internal discussions. On the other hand, if you have a directory of standout articles, infographics, and case studies to choose from, they’ll have an easier time seeing things your way. In other cases, the part-time creators were confined to certain channels.
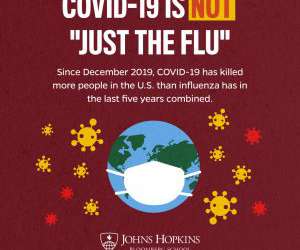
Here, the team collectively answered questions about their strategic internal and external outreach, which reached and engaged new audiences during the tragedy of a global pandemic and helped the Bloomberg School retain its No. 1 ranking in the latest U.S.
Whitepapers ranked the highest (82 percent) on the type of content most B2B buyers rely on, followed by webinars (78 percent) case studies (73 percent), e-books (67 percent), infographics (66 percent) and blog posts (66 percent). Another study reinforced the importance of quality content. Consider a professional writer.
We organize all of the trending information in your field so you don't have to. Join 48,000+ users and stay up to date on the latest articles your peers are reading.
You know about us, now we want to get to know you!
Let's personalize your content
Let's get even more personalized
We recognize your account from another site in our network, please click 'Send Email' below to continue with verifying your account and setting a password.


Let's personalize your content