This site uses cookies to improve your experience. To help us insure we adhere to various privacy regulations, please select your country/region of residence. If you do not select a country, we will assume you are from the United States. Select your Cookie Settings or view our Privacy Policy and Terms of Use.
Cookie Settings
Cookies and similar technologies are used on this website for proper function of the website, for tracking performance analytics and for marketing purposes. We and some of our third-party providers may use cookie data for various purposes. Please review the cookie settings below and choose your preference.
Used for the proper function of the website
Used for monitoring website traffic and interactions
Cookie Settings
Cookies and similar technologies are used on this website for proper function of the website, for tracking performance analytics and for marketing purposes. We and some of our third-party providers may use cookie data for various purposes. Please review the cookie settings below and choose your preference.
Strictly Necessary: Used for the proper function of the website
Performance/Analytics: Used for monitoring website traffic and interactions
Business Wire’s media survey revealed the three most important elements of a news release are multimedia assets such as video, pictures, logos, and infographics (57%); contact information (51%); and company background (38%). H ow do you catch a reporter’s eye?
Cision’s annual survey of more than 1,550 North American journalists and influencers reveals key findings on how journalists use news releases and multimedia to tell better stories.
Here at SHIFT, we coupled our love of candy and data to create the infographic below ( click for larger image ) showcasing consumers’ Halloween candy buying and spending habits. Like most creative pieces, the infographic was an evolution and team effort that didn’t happen overnight. Or where they’re buying them? Zach Burrus.
So we put together a survey and gathered some topline information about how practitioners are using content, what they are producing and why. Check out the survey highlights in our original infographic and read more in our news release. Survey shows 64% of #PR and marketing pros will Click To Tweet.
Last week, we released the State of the Media 2016 Report , which used a survey of over 300 journalists and Cision’s own media experts to provide insights into how to build better relationships with the media and earn more coverage. More than half of journalists use social to source stories.
A brand-sponsored survey is a time-honored tool for public relations. But how do you ensure the success of a given survey? Like any PR vehicle designed to generate positive press response, the success of even an inexpensive omnibus survey begins with careful design and a strong media strategy. Always begin at the end. .
Infographics. I love infographics. I’m not alone, over 40 percent of marketers say infographics are their most engaging piece of content. Infographics are easy to read, easier to digest and boost engagement by up to 3x. To promote an infographic, you first have to create an infographic.
In running high-profile consumer and B2B public relations campaigns over the years, we’ve learned some important tricks for making surveys work harder. As any good PR person knows, a well-designed survey can help increase earned media exposure and sharing of branded content. Put an even longer tail on survey results.
This clearly indicates, as stated in the IR magazine article – Investors visit IR websites for content, not data, finds survey – that the IR website is “…a de rigueur tool that investors expect to find.”. The post Infographic: Where Institutional Investors Read News and Earnings Releases appeared first on Cision.
The data is often derived inexpensively from behavior surveys or flash polls, or it may already exist within the company’s own research unit. Journalists look for pitches that are backed up by data in the form of charts, graphs, tables, or interactive infographics. Infographic from a 2017 article in MarTech Advisor.
Infographics, reports and research are ideal because they provide real value to anyone writing content on the subject you’re an expert in. Conduct a survey on a topic that is important to your audience. You could send survey questions via social media and email, and get a sizeable response. Create Highly Shareable Content.
” It occurred to me that some people treat infographics like my three-year old treats “Starships.” One recent infographic illustrated this point quite well. Consider this infographic that I created. How Do You Like Them (Infographic) Apples? The problem with this is that this is simply one case study.
In a recently published survey of Chief Communications Officers (CCOs) by Nasdaq, the majority of CCOs reported that they are now held accountable for marketing KPI such as website traffic, sales and lead conversions and content marketing. PR is now being fueled by the omnipresence of digital content.
Download the full PDF version of the infographic here . Adding data visualizations , infographics, images, and videos to your text not only makes it more interesting and attractive, but it can help your message to be absorbed better too. 2023 is right around the corner. Now would be a perfect time to do that. 888 243 3470.
Infographics remain high on the marketing list of tactics. This week I looked at Google search data for the word “infographic” (and variations) and found interest continues to grow at a steady pace. We see infographics in content marketing survey results as well. But Those Troubled Infographics.
A recent survey from digital communications platform ISEBOX reveals why journalists are unsatisfied with the resources communication professionals provide. Fifty-four percent of journalists surveyed said poor search tools were a major failing of digital newsrooms. Make sure your digital newsroom is up to journalists’ standards.
The first thing most ambitious marketers do when beginning their marketing adventure is to plan the tactics and choose the forms of the content they want to publish (blogs, videos, podcasts, infographics, etc.). Diversify content by using a variety of forms like infographics, videos, graphics and images. Growing Competition.
In fact, a survey carried out by Forrester Consulting found social media to be the most preferred source of discovery for news and information among online adults between the ages of 18 and 55. The survey also revealed that a young millennial follows an average of 121 publishers on the social media. Offer Variety. Think again.
Many of the blog posts published here are based on survey research, analytical studies or other sources of data. Every entry links to both the article I originally wrote – and to the underlying source, report or survey. Some 68% of B2B professionals surveyed say it takes longer to complete B2B sales cycles compared to a year ago.
A new survey of primarily corporate communications professionals identified the hottest trends and tactics in PR – and perhaps those that aren’t so hot too. The 2018 JOTW Communications Survey from Frank Strong. The survey was conducted in February 2018 and 155 respondents completed the questionnaire.
For many of our clients we field quarterly surveys designed to generate relevant news or insights. Surveys are the data gift that keep giving. Polls and surveys are time-honored PR tools for developing campaigns, fine-tuning messaging, and generating earned media and content. Omnibus surveys.
The Social Times recently published an infographic by a UK-based software company called SDL. It calls for “global customer experience wakeup call” and is based on a survey of nearly 3,000 people in nine countries. The post Infographic: The Perennial Customer Revolution appeared first on Sword and the Script.
Using surveys, interviews and focus groups, we spoke to employees across different lines of the business and regions. For our rebrand launch, it was incredibly important to have our employees voice their views and opinions on our global brand and identity so that we can best serve our amazing clients. Tell all your stakeholders. Conclusion.
That’s according to a survey of 1,200 “social dads” by Social Media Link and presented in the infographic – Dads Do Social – published nearby. In an introduction to the infographic, marketing director Jordon Ben writes: “Today’s dads are social, vocal and see their online world as a communal resource to help them make decisions.
Most PR professionals say media relations is getting harder or much harder, according to the 2019 JOTW Communications Survey. Over the last few months, there have been three separate surveys that polled hundreds of editors, reporter sand journalists. This is up 17% from last year where 51% said media relations was getting harder.
According to a Marketwired survey in November 2015, PR and marketing professionals plan to increase their content marketing programs by 64% in 2016. According to the same survey, 79% of these professionals have a content marketing plan in place. Your content must be relevant, meaningful and useful to capture your audience’s attention.
Cision’s annual survey of more than 1,550 North American journalists and influencers reveals key findings on how journalists use news releases and multimedia to tell better stories. RISING 2017 MEDIA TRENDS.
Accenture surveyed about 935 CMOs and 564 CEOs around the world and found 17% of respondents said, “they have been extremely successful at delivering highly relevant customer experiences.” Comment: The survey data about engagement in digital reflects my experience over the course of my career. click image for higher resolution ).
For the purpose of satisfying curiosity, marketing surveys are a useful vehicle for research. To that end, this post summarizes five recent market research surveys worth of a purposeful poke and pry. That’s according to a survey of 150 marketing leads conducted by executive search firm Spencer Stuart as reported by Marketing Charts.
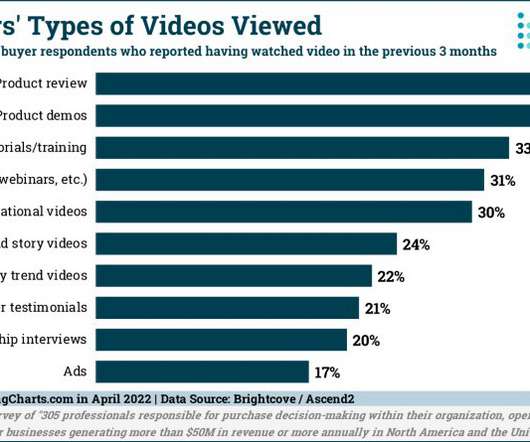
A recent survey commissioned by Brightcove and conducted by the research firm Ascend2 got me to thinking about video again. If you enjoyed this post, you might also like: “Skepticism” is the “New Normal;” Survey Finds B2B Tech Has Trust Issues. A few months later the video was all but forgotten. Recent B2B marketing video statistics.
Now in its sixth year, the report is derived from a survey of 1,521 North American B2B marketers. My perspective on last year’s B2B survey can be found here: Study: Effective Content Marketing Has One Element. The survey found considerable organizational confusion as to what effective content marketing looks like.
Consider the following findings from Cision’s 2023 State of the Media Report , a survey of more than 3,000 journalists worldwide: Press releases are cited as the resource journalists want to receive the most from brands and PR professionals Journalists ranked press releases No. reveals,” “shows,” “announces,” etc.)
Nearly half of the reporters surveyed in Cision’s State of the Media 2016 Report stated they used video- and image-based content in their stories. Help reporters reach these on-the-go content consumers by pitching videos, infographics or other mobile-friendly multimedia. Survey The People.
Nearly three-quarters (72%) of B2B buyers say they consume three or more pieces of content before engaging a salesperson, according to a survey by Demand Gen Report. The survey had insight here too. Among the most popular content formats for early-stage research were infographics (62%), blogs (58%) and podcasts (56%).”.
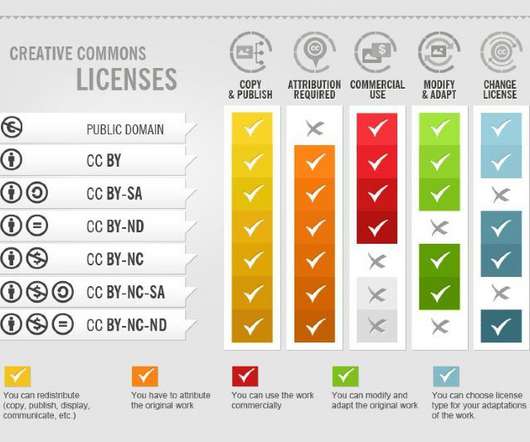
I had plans to cover a survey – as I often do with attribution. The images published below are based on an infographic by Foter that explains the concept graphically. This isn’t the post I intended to publish today. But as I dug into the report, I noticed one small thing that gave me pause: a copyright mark.
Pull the whole idea together as an infographic or slide show to illustrate for media, especially for digital who could end up using piece as is. Craft a seasonal survey. Or, for a wine or spirits company, find a twist on holiday alcohol consumption like this recent survey did. Predictions are a perennial.
A survey by Spiceworks Ziff Davis found B2B tech marketing prospects say they consume 11 or more piece of vendor content Pieces of content. According to a survey by Spiceworks Ziff Davis, about half (47%) of B2B technology decision-makers say they consumed 11 or more piece of vendor content over one year. Consumption.
Use surveys and A/B testing to get an even clearer picture of the type of communication your audience prefers. While text-heavy content is not very inviting, multimedia like interactive quizzes, infographics and live videos will be more likely to attract attention. Use your findings and send different messages to different audiences.
Wakefield Research adds value to traditional PR surveys. This survey provider goes the extra mile in a couple of ways. Consulting journalists and PR pros have helped the company create a guide that includes headlines, story angles and ideas for infographics that appeal to media.
Cision’s State of the Media 2016 Report lists the four most important media trends, according to a survey of more than 300 journalists. Multimedia content, such as infographics or Slideshare presentations, will help you stand out from other brands pitching the same old standardized template. This explains why almost half (48.9
Back in December, one of my colleagues penned a piece on using surveys to generate coverage and increase brand awareness. If a quick Google search reveals that your survey results are old news, a reporter is likely to pass. After an initial survey idea is formed, you may have a lively brainstorm session to collect ideas on a direction.
Nearly three-quarters (73%) said they believe “most vendors fall short” of the honesty mark, according to a third-party survey commissioned by Rob Roy Consulting. Read more: “Skepticism” is the “New Normal;” Survey Finds B2B Tech Has Trust Issues. Read more: Communications Influence with C-Suite Grows [Gartner Survey].
The ECM 2017 survey is based on responses from 3,387 communication professionals in 50 countries. The ECM 2017 survey was organised by the European Public Relations Education and Research Association (EUPRERA) and the European Association of Communication Directors (EACD), with support from PRIME Research. #1 But only 4.6% and 9.6%).
Online surveys and focus groups are extremely helpful in this regard. If your communication doesn’t stand out with pictures, infographics or banners, people are either deleting or ignoring your messaging, says Amie. For each campaign, focus on a theme to help unify all your messages. Above all, consider your culture.
We organize all of the trending information in your field so you don't have to. Join 48,000+ users and stay up to date on the latest articles your peers are reading.
You know about us, now we want to get to know you!
Let's personalize your content
Let's get even more personalized
We recognize your account from another site in our network, please click 'Send Email' below to continue with verifying your account and setting a password.


Let's personalize your content