This site uses cookies to improve your experience. To help us insure we adhere to various privacy regulations, please select your country/region of residence. If you do not select a country, we will assume you are from the United States. Select your Cookie Settings or view our Privacy Policy and Terms of Use.
Cookie Settings
Cookies and similar technologies are used on this website for proper function of the website, for tracking performance analytics and for marketing purposes. We and some of our third-party providers may use cookie data for various purposes. Please review the cookie settings below and choose your preference.
Used for the proper function of the website
Used for monitoring website traffic and interactions
Cookie Settings
Cookies and similar technologies are used on this website for proper function of the website, for tracking performance analytics and for marketing purposes. We and some of our third-party providers may use cookie data for various purposes. Please review the cookie settings below and choose your preference.
Strictly Necessary: Used for the proper function of the website
Performance/Analytics: Used for monitoring website traffic and interactions
We are frequently asked by clients why they should include photos, videos and infographics with their news releases. Here are just a few of the benefits of adding multimedia to your story, and how to pick the best content to supplement your news.
You can download the Infographic here on my blog, which details a FEEL-First Test with questions to answer before you communicate. Please share this Infographic with any modern communicators or business professionals you know who are trying to reach younger audiences. Do you really know who you’re trying to reach and engage?
According to the Cision 2017 State of the Media Report , when communicators pair compelling messages with rich formats like photos, videos, social media posts, infographics and data, they can drive better and more accurate coverage and increase earned media opportunities. RISING 2017 MEDIA TRENDS. Keep it short and sweet.
Business Wire’s media survey revealed the three most important elements of a news release are multimedia assets such as video, pictures, logos, and infographics (57%); contact information (51%); and company background (38%). H ow do you catch a reporter’s eye?
Major brands like Apple and Tesla now regularly include high-resolution images, videos, and interactive elements in their announcements. Research from PR Newswire shows that multimedia press releases generate up to 9.7 times more views than traditional text releases.
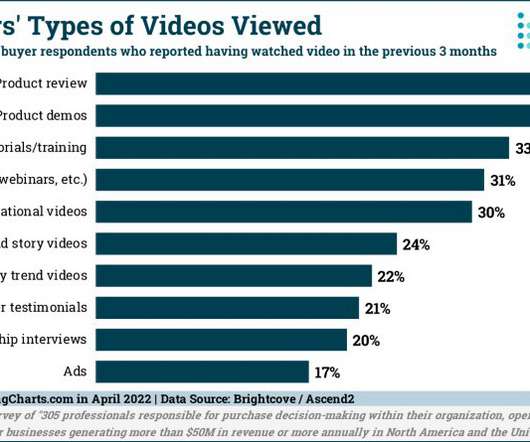
As much as video content has grown in advertising, marketing, and PR , data shows that it continues to expand. WebpageFX predicts that by next year, 90% of online content will be video. Video enhances SEO, has the best ROI, keeps consumers engaged longer, and is more shareable than many other content forms. A public-facing CEO.
The easiest way to do that is by including multimedia elements — whether photos, infographics, videos or audio clips. Most companies have websites full of engaging images and video to appeal to online audiences. So why not apply the same rules to your press releases, to get more attention? Personalize Your Brand. Conclusion.
when using Zoom, or another service, you don’t want to come off like the jokers in the SNL video, above. When asked to create an infographic, e.g., we often call in a partner with this skillset. Visme makes it easy to design infographics, and other visuals that combine data and charts. Designing at Home.
Infographics. I love infographics. I’m not alone, over 40 percent of marketers say infographics are their most engaging piece of content. Infographics are easy to read, easier to digest and boost engagement by up to 3x. To promote an infographic, you first have to create an infographic. Ah, video.
I’ll share articles, videos from class lectures, or other resources that would be helpful. When I require students to “sign in” for attendance by tweeting a resource related to the class topic, I immediately see new articles or videos that I hadn’t yet discovered. I place this on my syllabus so students all have it handy.
93% of buyers “video builds trust in a brand” but success with video in B2B marketing requires a clear purpose, a plan to promote and measure results. By contrast, video is harder to experiment with in that way. A study by PathFactory found marketing videos on average cost $8,448 and earned 2:22 minutes of viewing time.
Infographics demonstrate your brand’s expertise in your industry. Videos provide an engaging visual and sound clip to tell your audience what they need to know about your news. The same HubSpot report indicates that users are more likely to consume videos in full (55 percent) than any other form of online content.
Download the full PDF version of the infographic here . Adding data visualizations , infographics, images, and videos to your text not only makes it more interesting and attractive, but it can help your message to be absorbed better too. Each year video usage online continues to grow. 2023 is right around the corner.
My FEEL First research and the accompanying model [ Note : this is the 2nd iteration of the Infographic] came to life after the tragic loss of a loved one, my stepdaughter. Here’s my video with more on FEEL First and how to take this approach to a new level. I had to say goodbye to a cherished relationship.
Infographics demonstrate your brand’s expertise in your industry. Videos provide an engaging visual and sound clip to tell your audience what they need to know about your news. The same HubSpot report indicates that users are more likely to consume videos in full (55 percent) than any other form of online content.
Infographics. Informative, aesthetic infographics drive immense engagement. Infographics are plug and play, citable and are liked and shared 3x more on social media. OpenTable used infographics to garner earned media and boost engagement from targeted yet unexpected audiences. Increase views and engagement by up to 2.8x
It’s all about quality- quality writing, well-produced videos and infographics, and, more than ever, creating immersive, multimedia content experiences. In terms of measurement, every article we publish, every video we create, every immersive ad we delivered is directly tied to in-depth metrics.”. In terms of getting noticed?
In this video, Baer talks about how influencer marketing is a powerful strategy that can easily go wrong. Click the image to view the video or read the transcript below. Click the image to view the video or read the transcript below. And if you want to check out the entire series of Jay Baer Asks videos click here. .
The trick is to develop a group of content creators across functions that consistently shares interesting articles, posts, videos and more with each other – and then your clients or customers. Marketing and PR teams will need to work together to create compelling content that serves customers across all platforms and channels.
If you’re interested in learning more about how to FEEL first and knowing the AGENDA before your interviews, here’s a video about a workshop on speaking and media interviews that may help you. Do you know the AGENDA before your media interviews?
One launch could spur posts like a video review of the product, a tutorial on how to use it, or even the story behind its creation. You never know which notes you take from the event can become blog posts, videos, infographics or ebooks. If you always publish 600-word blog posts, mix it up with a video post.
Because we love you, one handy dandy, super duper, mostly all-in-one-place Brand Video Checklist to ensure you don’t forget anything when you develop, write and shoot your next video. You mean that much to us…
Make sure to Like and Subscribe to our You Tube Channel by clicking HERE so you know about all of our great videos like this right when they come out. Go to www.Canva.com and create great free images (already pre-sized for you) or record videos to go with these topics. Create and post a video. How to Create Content Fast?
You can accomplish both tasks using the video function on your smart phone or other tools such as Skype for the desk top or Google+. Upload the resulting audio or video file to your YouTube channel allows you to institutionalize it for all to see and hopefully marvel. If you do not have a YouTube channel create one.
Design: An awful lot of content today is visual – photography, original images, social media images and infographics. And video is growing at breakneck speed. Devising a content strategy that cuts through the noise and gets results requires quite a few skills: monitoring conversations, analyzing data and tracking results.
1 Paid search, display ads, social media, online video advertising and email marketing will grow to 46% of advertising budgets 2. PR now incorporates video content and online visuals (like infographics) to drive brand narrative and reinforce marketing messages throughout the customer lifecycle. PR and marketing convergence.
The first thing most ambitious marketers do when beginning their marketing adventure is to plan the tactics and choose the forms of the content they want to publish (blogs, videos, podcasts, infographics, etc.). Diversify content by using a variety of forms like infographics, videos, graphics and images.
Consider different formats, such as blog posts, articles, infographics, videos, and podcasts. Use storytelling techniques to make content more memorable. Optimize content for search engines (SEO) to improve visibility. Another strategy is to utilize social media. Identify the social media platforms most active for the target audience.
Journalists look for a few mandatory elements to build a story, including colorful quotes, images or video, and supporting data. As they try to make their content more interactive and share-able for their audiences, journalists are incorporating more elements like images, videos, and infographics.
Video content proves particularly effective for education. These videos typically see higher engagement rates than traditional written content, with some achieving 70% completion rates. These videos typically see higher engagement rates than traditional written content, with some achieving 70% completion rates.
Make it easy for reporters to tell a compelling story by adding photos, videos, and infographics. Give them easy content to use including infographics, PDFs, and Customer Testimonials. Include videos but keep them short. Reporters need your multimedia content to create a compelling story. Humans are visual learners.
Leverage Visual Storytelling Utilize high-quality images and videos to evoke emotions and create a strong brand identity. Consider using videos, infographics, quizzes, and live streams to cater to diverse preferences. Showcase beautiful settings, social gatherings, and cultural moments that resonate with the target audience.
Consider incorporating visuals, such as infographics or videos, to enhance engagement. Focus on creating high-quality content that is informative, engaging, and valuable to the audience. Ensure the content is well-researched, well-written, and free from errors.
Content silos form when you group content by date or type (blog posts, videos, etc.). For instance, if a blog post does extremely well, you can then make a video, slideshow and an infographic to get a better momentum. Content silos are harmful for your overall content marketing since it creates dead ends in your engagement path.
Infographic. If you are announcing research or statistics you’ve put together, infographics can be a great tool for visually relating them. You can create your own infographics with Piktochart or hire a professional designer. If you’ve got a relevant video, it can make a fantastic addition to your press release.
Focus on truly newsworthy announcements and include multimedia elements like images, videos, and infographics that make your story more shareable. Share original research, industry analysis, and customer success stories that journalists can reference. Press releases still matter but require a modern approach.
Create valuable content, such as blog posts, videos, and infographics, to educate and inform the target audience. Engage with the audience on platforms like Instagram, Facebook, and TikTok through targeted advertising, contests, and influencer partnerships.
Depending on your audience and goals, a long-form blog post, a video, or an infographic may be more appropriate. Consider what type of content your audience engages with most and the message you want to convey—blog posts for in-depth information, videos for visual storytelling, or infographics for data visualization.
Whitepapers, e-books, infographics, video, podcasts…all are fair game when it comes to reaching your audience. When it comes to content marketing, the best strategies go beyond just churning out a lot of blog content. But today, for simplicity’s sake, let’s just cover e-books.
As video content becomes increasingly popular, businesses are looking for ways to maximise the return on investment (ROI) from their video content. Repurposing video content is an excellent way to achieve this, allowing brands to get greater use of captured content while growing a number of channels and platforms.
and clearly articulates the who, what and why Includes compelling, high-quality visuals: photos, videos, infographics or data visualizations Features content that adds credibility and validation: unique data or research, testimonials or quotes from experts or executives Is formatted strategically (e.g.
Infographics. Infographics , which visually interpret data, appeal to visual learners. If you’ve got rather dry data, turning it into an infographic is a great strategy for getting people to give a crap. If you’ve got rather dry data, turning it into an infographic is a great strategy for getting people to give a crap.
Cision’s 2016 State of the Media Report found that journalists saw multimedia journalism and video- and image-based content as two of the most important trends of 2015. By providing journalists with images, videos and infographics that they can use in their stories, you’ll increase the likelihood that they’ll cover your brand.
So whilst thinking about what formats can work best, try to avoid saying “I want to create an infographic” or “I want to create a video”. This is often easier than updating a more complex execution such as an interactive infographic because it is usually a case of updating copy and visuals with new ones. Static infographic.
We organize all of the trending information in your field so you don't have to. Join 48,000+ users and stay up to date on the latest articles your peers are reading.
You know about us, now we want to get to know you!
Let's personalize your content
Let's get even more personalized
We recognize your account from another site in our network, please click 'Send Email' below to continue with verifying your account and setting a password.


Let's personalize your content