This site uses cookies to improve your experience. To help us insure we adhere to various privacy regulations, please select your country/region of residence. If you do not select a country, we will assume you are from the United States. Select your Cookie Settings or view our Privacy Policy and Terms of Use.
Cookie Settings
Cookies and similar technologies are used on this website for proper function of the website, for tracking performance analytics and for marketing purposes. We and some of our third-party providers may use cookie data for various purposes. Please review the cookie settings below and choose your preference.
Used for the proper function of the website
Used for monitoring website traffic and interactions
Cookie Settings
Cookies and similar technologies are used on this website for proper function of the website, for tracking performance analytics and for marketing purposes. We and some of our third-party providers may use cookie data for various purposes. Please review the cookie settings below and choose your preference.
Strictly Necessary: Used for the proper function of the website
Performance/Analytics: Used for monitoring website traffic and interactions
According to the Cision 2017 State of the Media Report , when communicators pair compelling messages with rich formats like photos, videos, social media posts, infographics and data, they can drive better and more accurate coverage and increase earned media opportunities. RISING 2017 MEDIA TRENDS.
The most effective multimedia elements include: Product demonstration videos Infographics highlighting key data points High-resolution product images Interactive charts and graphs Downloadable media kits Social media-ready visual assets Companies like Samsung exemplify this multimedia approach.
Here’s a preview (you can click the below image to download the.pdf version of this document): Remember! Crisis and Issues Management Dealing with Negative Criticism Employees and Crisis Management Infographics' Create appropriate messaging for responding to issues. It’s only one piece of the puzzle.
There are many different resources available for clean, professional and powerful digital documents. of proposals see higher engagement from visuals such as infographics and original images. . Make it look appealing. Decks should be both visually appealing and informative. Are you using a readable font? Data has shown that 41.5%
According to research by Semrush, content marketing leaders are 3x more likely to report success when they have a documented content strategy backed by data. Data analysis and measurement tools now give content creators unprecedented ability to understand their audience and create content that resonates.
Journalists look for pitches that are backed up by data in the form of charts, graphs, tables, or interactive infographics. Infographic from a 2017 article in MarTech Advisor. Infographics also offer SEO opportunities for both the news outlet and the sponsor. 5 reasons to embrace data-driven PR.
That’s a lot to rest on the shoulders of a single powerhouse document! Depending on your audience and goals, a long-form blog post, a video, or an infographic may be more appropriate. Lastly, whenever a new team member joins, this document can become a key point of reference to help them get up to speed.
In a lot of ways, effective visual communication is about a whole lot more than just finding pretty pictures to pair up with relevant text on a document like an infographic or a presentation. The post The Disciplinary Concepts at the Heart of Visual Communication appeared first on Prowly Magazine.
Even while channels proliferate to communicate your passions, position and career preferences, the resume remains firm as your calling card and one of the essential documents that helps you define who you are, what you do and the value you bring to the table.
This is your master document that states all the rules of your brand — brand colors, logo placements, rules covering use of logo, photo suggestions and image choice guidelines, etc. Some companies have a set of icons that they use on all their documents or brochures etc. Logo Files. The most important is the logo. versions and png.
. “One app I highly recommend is called SignEasy which, as its name suggests, makes it easy for you to sign documents via phone or tablet,” says Sarah Rose Attman, who launched her own PR firm two years ago. “In our world of getting-shorter-all-the-time attention spans, pictures (videos, infographics, etc.)
Essential Tools Consider implementing: Content management systems Media monitoring platforms Social media management tools Analytics and reporting software Project management solutions Content Repurposing and Adaptation Make content work harder by adapting it for different channels and audiences.
It also isn’t just limited to slide decks; you can upload videos, infographics, images, and documents. It also now has Haiku Deck design software on the SlideShare website, instead of separately only for iPad users, so it has a fantastic resource to CREATE a slide deck, if you don’t have any.
According to the Cision 2017 State of the Media Report , when communicators pair compelling messages with rich formats like photos, videos, social media posts, infographics and data, they can drive better and more accurate coverage and increase earned media opportunities.
Once a simple paper document, todays press releases are often multimedia-rich, socially shareable, and optimized for search engines. Including visuals like images, videos, infographics, or downloadable assets can significantly increase engagement. The humble press release has come a long way.
Here, you can find ebooks, infographics, webinars and templates to help you: Grow blog traffic. The cost: HubSpot’s repository of information is free, but you may need to give them your email address to access certain documents. Create a social media content calendar. Design a website. Develop appealing slide presentations and more!
1) Infographic: USA Today was the first to own the infographic because snappy visuals help show the news instead of simply telling it. At the root of all the drama this little document creates is the fact that content quality, not content format, is the real issue. :: Originally posted on Strategic Public Relations.in
The infographic below shows that this year, B2B and B2C marketers will create more content than in the previous year with the majority planning to use content marketing as an ongoing, rather than campaign strategy. Content Marketing Statistics Infographic is provided by Point Visible.
Working with documents. Project Collaboration: We’re creating material like articles, press releases, images, videos and infographics (or you should be!) Working with documents : Digital documents are the backbone of the modern workplace. Project collaboration. Attention management. Communication.
In fact, a creative media kit that showcases the brand’s personality, is much more likely to be successful than a simple set of documents. Some look like resumes, using bulleted lists, while others use infographics and visuals to convey valuable information about a brand. Evolution and History of Media Kits. Creative Media Kit Ideas.
Frequently over used and abused because of the perceived low cost and ease of automation Graphics – information communicated via visual design; infographics are frequently used as a visual way of presented data Podcasts and video – an audio and/or visual means of communication that is frequently educational or informational.
That’s because the standard on the internet for anything that shall catch our attention is that it at minimum, must include an image, but for the most part it includes some sort of combination of multimedia – images, documents, videos and audio. It makes good sense. Our brains process images faster than it processes text.
Some sources found to be valuable for generating content marketing ideas, include: Document customer’s responses and questions and respond to their posts or write e-books responding to their questions. White papers, webinars, infographics, and case studies are also widely used.
Text, video, illustration, slideshow and infographics are all formats to explore and consider. Voice and tone – Match the tone in which the publisher speaks, whether that is informational, technical, humorous, etc. Format – The same content can be published in different formats, depending on the audience and the publication.
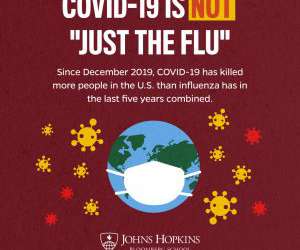
A great example of this was our “COVID is Not the Flu” infographics, which reached over 20 million users on Facebook alone. In January 2020, we published a news release on FDA documents revealing inadequate monitoring of a key program to promote safe opioid use.
You can create a document (or an infographic like the one below) that outlines what kind of content fits into each sentiment analysis category. What kind of coverage would get a 10 on the scale and what would get a 1? It’s also important to consider how you’re going to keep consistency the same over time and across team members.
An infographic is included that shows how Cision Impact builds on the Cision Communications Cloud ® , to deliver the most complete PR workflow platform — from identifying influencers to reporting revenue generated. . Engagement – Click-Throughs, Image Views, Video Plays, Document Opens/Downloads, Audio Plays. About Simon Bossick.
If you haven’t documented your 2015 strategy yet, impress your c-suite by using these free Content Marketing Management Toolkit templates that evolved from a Smart Insights – Hubspot collaboration. Download The Essentials of a Documented Content Marketing Strategy: 36 Questions to Answer here. It’s a keeper.
Or, maybe your team just needs richer documentation and brand standards, so everyone is rowing in the same direction. For example: Multimedia content: Videos, infographics, podcast An estimated 3.63 .” Is now the time to redefine your brand or bring new ideas to the table to present a creative but unified new front?
A content strategy is a living document. When first documenting a strategy, your initial goals are more like educated guesses. If you only produced blog posts before, maybe scaling means starting to create visual content like infographics and video. What’s not as obvious is how they should adjust their plan when scaling.
Success with healthcare PR means incorporating attention-grabbing fonts, rich images, engaging video and story-telling infographics. There are other considerations of content in FDA Guidance documents, but you get the gist. Counting words won’t cut it here. But all is not lost – just follow a couple of simple rules.
In 2015, distributing press releases that include multimedia content is paramount – documents, images, video, and infographics not only need to be included, but ideally should all be released together in a multimedia news release (MNR).
Even before signing contracts and commitment to all of your workload criteria, you should all agree such documentation is essential. Don’t forget all of this should be part of your criteria of performance delivery for crisis communications. Does all of this seem too tough or excessive to demand of the agency? Well, don’t be squeamish.
Many journalists like to read press releases with infographics or videos, so include them here. If you have essential things that require more than one page to write about, you should release a different document. When you are cutting a document down, cut out all of the fluff. The second paragraph is where you back your claims.
I came across this absolutely wonderful infographic yesterday that explains different types of complainers and how best to handle them. It also doesn’t hurt to turn that planning into a written document. They’re unavoidable on social media and most of us quake in fear at the thought of handling them wrong.
Either a) by being a thought leader in the space you’re in (typically manifested via blog) or b) by creating content for which your audience is willing to exchange contact information (think video, infographic, document, etc.). An infographic or infovideo highlighting the benefits of the merger: awesome for today’s visual world.
The purpose of press releases is to make an exciting announcement or to share important news with your audience, making social media a great place to share these documents. Infographics are another great tool to use to break up your written content. Craft a Creative Headline.
Candidly, I was underwhelmed by some of the top line findings (of course PR people use email and create documents), however, there were some other interesting stats if you dig through the report. Learn more: report registration page ; PR News infographic. Muck Rack polled about 800 PR pros for a survey about the state of the industry.
Principles of our storyselling approach Teach own learnings: Everything we learned, we documented in videos, blog posts, infographics, Build practical solutions: We built a bunch of tools and services to make life easier for our target audience.
A copy of the document that was allegedly sent to reporters included edits to the company CMO had previously suggested – but weren’t for public consumption. wrote Siftrock in a press release about being included as one of the nearly 7,000 other logos on the marketing technology landscape infographic. The edits were eccentric.
Infographics. Document and prepare for distribution across your brand’s key channels, which should at the very least include: Web. Here are some ideas for multimedia based content that you can infuse into your press release in order to garner more eyeballs: Photos.
Depending on how you visualize your data studies and survey results, you may choose to use an infographic, which is the next tactic on this list.) Create InfographicsInfographics have worked so well in the past because they provide a “physical” asset for bloggers to share within their blog posts.
Companies can use their tools and technologies to create interesting and attention-grabbing pieces of content such as infographics and videos, that can convey information in a good way to both consumers and media outlets.
Read the results for yourself in this handy infographic – but suffice to say, having a newsroom for your company has never been more important in a crowded content world. That’s why we recently conducted a major survey with journalists to see what it is that irks them most about corporate newsrooms. And, the findings aren’t good.
We organize all of the trending information in your field so you don't have to. Join 48,000+ users and stay up to date on the latest articles your peers are reading.
You know about us, now we want to get to know you!
Let's personalize your content
Let's get even more personalized
We recognize your account from another site in our network, please click 'Send Email' below to continue with verifying your account and setting a password.


Let's personalize your content