This site uses cookies to improve your experience. To help us insure we adhere to various privacy regulations, please select your country/region of residence. If you do not select a country, we will assume you are from the United States. Select your Cookie Settings or view our Privacy Policy and Terms of Use.
Cookie Settings
Cookies and similar technologies are used on this website for proper function of the website, for tracking performance analytics and for marketing purposes. We and some of our third-party providers may use cookie data for various purposes. Please review the cookie settings below and choose your preference.
Used for the proper function of the website
Used for monitoring website traffic and interactions
Cookie Settings
Cookies and similar technologies are used on this website for proper function of the website, for tracking performance analytics and for marketing purposes. We and some of our third-party providers may use cookie data for various purposes. Please review the cookie settings below and choose your preference.
Strictly Necessary: Used for the proper function of the website
Performance/Analytics: Used for monitoring website traffic and interactions
A Guest Post by Amanda Levenson, UMASS at Amherst Student, PR Expanded Infographic Contest Winner. For the PR Expanded Infographic contest, I chose to offer insight on how to build and preserve successful relationships with reporters. I selected this topic because I am a Journalism major with five internships under my belt.
According to the Cision 2017 State of the Media Report , when communicators pair compelling messages with rich formats like photos, videos, social media posts, infographics and data, they can drive better and more accurate coverage and increase earned media opportunities. RISING 2017 MEDIA TRENDS.
Editor’s note: How and when should social media be incorporated into today’s higher education? Carolyn Mae Kim, a hands-on professor teaching in the Journalism & Integrated Media department at Biola University, has some great tips and strategies to help today’s educators answer this important question.
We are frequently asked by clients why they should include photos, videos and infographics with their news releases. Here are just a few of the benefits of adding multimedia to your story, and how to pick the best content to supplement your news.
It’s the end of the summer and fall marks the busy season for professionals, as well as PR educators and students who are back in school. Once you identify a study and topics of interest, you can then take existing research and build your own infographics to showcase the information. I discovered.
What kind of “ Education ” is needed around the topic? Nailing down the education part means coming across clear and in a way that people will understand you. If you are an expert, does your interviewer have the same level of knowledge and what about their audience.
On Facebook, your top priority as a business is to educate. Mari suggests repurposing a video into everything from an infographic to a text post to social media ads to make the most of your efforts. Despite popular belief, repurposing content on Facebook or Twitter, is perfectly okay, says Mari. Create and Curate Other’s Content.
Though the CDC is attempting to educate the public, I continue to see first-hand that their efforts are falling short. 1) Hospital attendants and first responders MUST be prepared and educated. This means that better and more adequate training and education needs to be going on within each and every hospital.
Infographics. Informative, aesthetic infographics drive immense engagement. Infographics are plug and play, citable and are liked and shared 3x more on social media. Infographics are plug and play, citable and are liked and shared 3x more on social media. How to do it? Increase views and engagement by up to 2.8x
Infographics remain high on the marketing list of tactics. This week I looked at Google search data for the word “infographic” (and variations) and found interest continues to grow at a steady pace. We see infographics in content marketing survey results as well. But Those Troubled Infographics. 1) Data visualization.
Infographics. I love infographics. I’m not alone, over 40 percent of marketers say infographics are their most engaging piece of content. Infographics are easy to read, easier to digest and boost engagement by up to 3x. To promote an infographic, you first have to create an infographic.
Leading platforms like Betway have demonstrated this through their partnership with Ninjas in Pyjamas, where they’ve integrated betting education into team content and social media presence. Video content proves particularly effective for education. Social media channels offer ideal venues for educational micro-content.
Weaving educational content into a compelling narrative can transform complex information into an engaging experience. Infographics, images, and videos can break down complex information into easily digestible formats. Clear and concise language Effective communication is essential for educational content.
This shift saw the emergence of blog posts, white papers, ebooks, and webinars designed to educate, inform, and inspire. Consider incorporating visuals, such as infographics or videos, to enhance engagement. However, the evolution of thought leadership did not stop there. Today, a data-driven approach is paramount.
It contains only easy-to-read-and-learn content, featuring some of the best educational, how-to material on the use of Twitter. For those of you who love infographics ( I’m one of them ), you will also find the following: Twitter Best Practice Guidelines. collection. The Return of Investment (ROI) of Twitter Explained.
Create valuable content, such as blog posts, videos, and infographics, to educate and inform the target audience. Engage with the audience on platforms like Instagram, Facebook, and TikTok through targeted advertising, contests, and influencer partnerships.
They also fill their blog and YouTube pages with educational content, company updates and industry news, which they promote via social media. Infographics can be especially useful because they explain complex topics with the use of visuals. Brainstorm Related Topics. If you use visuals, more people will see your content.
According to the Cision 2017 State of the Media Report , when communicators pair compelling messages with rich formats like photos, videos, social media posts, infographics and data, they can drive better and more accurate coverage and increase earned media opportunities.
Content that educates and informs customers can build trust and authority in an industry or a company. Typical PR-generated content includes blog posts, opinion pieces, feature articles or testimonials, infographics, or videos.
Visual storytelling through infographics, videos, and interactive content helps break down complex concepts. Defense tech companies should invest in robust PR programs that prioritize public education, address concerns promptly, and maintain open dialogue with all stakeholders.
Effective communication is key to increasing participation and raising money for your PAC – not only for solicitation, but for marketing and education as well. Whether you’re communicating with the intent of solicitation or education, your communication should always be consistent. But how do you do it effectively? Stay consistent.
Our 2016 timeline infographic highlights some of the monumental challenges that affected journalists last year. Thomas Jefferson said , “An educated citizenry is a vital requisite for our survival as a free people.” Confidence in the media has recently eroded due to the recent U.S. ” He is right.
You can reincarnate it, vitalize it, and use the same idea (but in a new package) to entice, educate, and help your audience. You may not sell your own ebooks, but you could use it to acquire leads and educate your ideal customers. Extract Data from your Content and Design an Infographic. People love infographics.
The ability to create infographics, posters, reports and templates for free, or with a premium subscription, can really make your tweet stand out in a newsfeed. Yes, I’ve forged many meaningful relationships and have learned so much from our community of PR students, educators and professionals. Participate in Twitter chats.
Your audience can be defined by gender, age group, location, education, pain point, behavior and more. This means photos, infographics and other graphic elements that break up large chunks of text. Infographics. It’s a specific person who’s attracted to your brand message and the way that you articulate that message.
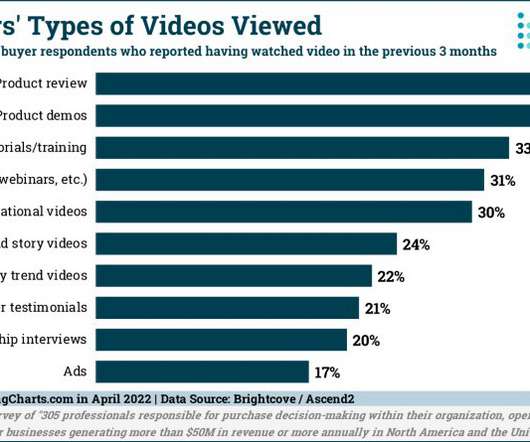
When you look at the six types of videos B2B professionals reported having watched, they are all educational themes. 97% of respondents said video content and communication were useful after making a purchase. 97% of respondents said video content and communication were useful after making a purchase. click image for higher resolution).
Enter infographics. An infographic defined is a data-rich visualization of a story or a thesis used to educate, inform, build brand awareness and create inbounds links. Read on to learn how and why infographics can add value to your marketing efforts.
Even if you have no intention of sitting in a classroom again, you can still continue your business education on your own. Here, you can find ebooks, infographics, webinars and templates to help you: Grow blog traffic. With the kids back in school, learning is in the air. Create a social media content calendar. Design a website.
Though the CDC is attempting to educate the public, I continue to see first-hand that their efforts are falling short. 1) Hospital attendants and first responders MUST be prepared and educated. This means that better and more adequate training and education needs to be going on within each and every hospital.
Fortunately, I found many of the ideas in the following infographic, produced by the no longer active Creattica, fun and motivating: “Read a page of the dictionary” is my favorite (am I the only one who used to do this as a kid??). The post 29 Ways to Stay Creative [Infographic] appeared first on Solo PR Pro.
Harrison Kratz shared an interesting infographic with me the other day, which I wanted to share with you. It’s called “Women @ Work” and, as you can probably tell, it’s a snapshot of where women stand today in the workplace. I don’t know. What do you think? Image: ell brown via Flickr, CC 2.0. Women at Work.
This infographic from SmartBlogger presents a nice visual checklist of 10 steps to produce all types of content from blog posts to white papers. You can use it as a client education tool to help outline what will be needed to produce content that people want to read. The Epic Content Cycle Infographic from SmartBlogger.com.
Frequently over used and abused because of the perceived low cost and ease of automation Graphics – information communicated via visual design; infographics are frequently used as a visual way of presented data Podcasts and video – an audio and/or visual means of communication that is frequently educational or informational.
I want to inform marketers about what they may have missed and educate them on how major technology changes affect the industry. I love including images, diagrams, infographics, or any other visual elements to a piece that will make it more valuable to the reader. for example, MMS is huge for marketers) I want news that matters.
The first part of your freelancer onboarding process should focus on educating them on these core details. On the other hand, if you have a directory of standout articles, infographics, white papers , and case studies to choose from, they’ll have an easier time seeing things your way.
Understanding the intricacies of demographics, such as age, gender, location, income, education, occupation, and psychographics, including interests, values, lifestyle, and behaviors, proves invaluable. Enhancing visual appeal with images, videos, and infographics helps break up text and improve content engagement.
If your CEO used to be a CMO , they’ll likely have quite a bit of knowledge in this area, but not everyone is so lucky and you may need to take this as an opportunity to (respectfully) educate. Visuals (photos, infographics, etc.). Tell them that all PR is content , and content is made up of: Channels. Newswires (press releases).
We quickly found that just talking about education and learning led to journalists being icy to us. So if there’s an infographic on a page, it won’t read it. Daniele: But if you give it, if you give it the infographic and say, read what’s on this infographic, it can read it. Vince: Oh, interesting.
Meanwhile, explainer videos are a terrific way to delight and educate consumers while dispensing with the hard sell. Verizon’s Oath uses video to take the traditional case study beyond the usual infographic or blog post. Make case studies more visual.
According to a Pew Internet study the majority (78%) of adult internet users watch or download videos, and among the most watched content is educational and how-to videos. The infographic below lists some valuable insights and handy tips to help you optimize a business YouTube channel: Getting Started'
It is about crafting a narrative that educates the public, fosters awareness of cyber risks, and positions cybersecurity firms as trusted partners in the fight against digital threats. Content Beyond selling, the focus is on education. It goes beyond simply promoting products and services.
Therefore, it takes time, education and patience to help new clients, who aren’t as familiar with SEO practices, to understand this. Of course, this can’t work well or seamlessly without initial education from you to your client. This is where educating your client becomes more important than ever. Infographics.
White papers, webinars, infographics, and case studies are also widely used. Blogs, videos, infographics, and ebooks should demonstrate to your potential customers that you know how to assist them and that you want to help them work out their problems. Average content marketers use thirteen different content marketing outlets.
We organize all of the trending information in your field so you don't have to. Join 48,000+ users and stay up to date on the latest articles your peers are reading.
You know about us, now we want to get to know you!
Let's personalize your content
Let's get even more personalized
We recognize your account from another site in our network, please click 'Send Email' below to continue with verifying your account and setting a password.


Let's personalize your content