This site uses cookies to improve your experience. To help us insure we adhere to various privacy regulations, please select your country/region of residence. If you do not select a country, we will assume you are from the United States. Select your Cookie Settings or view our Privacy Policy and Terms of Use.
Cookie Settings
Cookies and similar technologies are used on this website for proper function of the website, for tracking performance analytics and for marketing purposes. We and some of our third-party providers may use cookie data for various purposes. Please review the cookie settings below and choose your preference.
Used for the proper function of the website
Used for monitoring website traffic and interactions
Cookie Settings
Cookies and similar technologies are used on this website for proper function of the website, for tracking performance analytics and for marketing purposes. We and some of our third-party providers may use cookie data for various purposes. Please review the cookie settings below and choose your preference.
Strictly Necessary: Used for the proper function of the website
Performance/Analytics: Used for monitoring website traffic and interactions
Infographics remain high on the marketing list of tactics. This week I looked at Google search data for the word “infographic” (and variations) and found interest continues to grow at a steady pace. We see infographics in content marketing survey results as well. But Those Troubled Infographics. 1) Data visualization.
I'll just say that when I was working in a PR agency back 6-7 years ago, I was engaging a group of young beauty bloggers in a very similar fashion as influencer marketing preaches. So when I came across an infographic from smallbizgenius I knew I had found what I needed. Anyway, back to my research.
That’s according to a survey of 1,200 “social dads” by Social Media Link and presented in the infographic – Dads Do Social – published nearby. In an introduction to the infographic, marketing director Jordon Ben writes: “Today’s dads are social, vocal and see their online world as a communal resource to help them make decisions.
Because the old fashioned news pitch is going by the wayside. The sphere of influence that once belonged to traditional news outlets is slowly slipping away. And as public relations professionals, this means undergoing a transition that may be rather uncomfortable for some. Here’s why:
Although in the past the company has also launched fashion projects and engaged in sustainable energy, today, Pirelli is a pure tyre manufacturing company. Their newsroom is a most informative web destination covering Formula 1, governance, financial, and sustainability news with insightful and fun infographics, videos and more.
It’s also tactics like content marketing, a broad umbrella that includes blogging, social media updates, email marketing, infographics, visuals and video. The content is there, but we can’t find the piece of furniture we need until we categorize, catalogue and disseminate it in an orderly fashion.
They currently serve businesses in the fashion, beauty, lifestyle, travel, food and family space. Check out this infographic by The Shelf for even more V-day insights. Sabrina is the Marketing Manager for The Shelf , an influencer marketing platform that enables brands and agencies to connect with the most relevant influencers.
Rolex is timeless but not old-fashioned. For more inspiration, check out this brand archetypes infographic from Printsome. It encourages creativity and problem-solving without being overwhelming. This gets easier as you jump from brand to brand, and you can always try out a few before taking on your own. You get the idea.
Fashion/Beauty (29%) and Education (25%) topped the charts as the hardest industries to get links in. Data visualization/infographics by 34%, and videos by 33%. You need sound on-page SEO and technical SEO to reap the benefits of digital PR. Industry-Specific Stats 26. BuzzStream ) 27. Images are used by 72% of journalists.
Moreover, you can use high quality images, videos, infographics, tables or charts. Specifically, consumers look forward to changing to cooler weather fashion as a crispness fills the air. The company showcases its iconic fall fashion in a block of 15 photos displaying highly anticipated fall fashion.
We produce webinars , and publish white papers, and infographics, and the occasional blog post, and we publish this stuff all over the internet and on social media, so yes, we’re doing content marketing,’ these folks say. However, getting there requires patience, and planning, and a lot of good old-fashioned elbow grease.
Moreover, you can use high quality images, videos, infographics, tables or charts. Specifically, consumers look forward to changing to cooler weather fashion as a crispness fills the air. The company showcases its iconic fall fashion in a block of 15 photos displaying highly anticipated fall fashion.
It’s been around in some shape or fashion since the early days of the internet, and is now amplified through social media channels where brands freely share blogs and articles. Once you have produced the content like a video, blog, infographic or photo montage, choose a syndication site that works best for your needs and budget.
So, if you’ve got a one-track mind when conceiving campaign concepts e.g. thinking that a piece for a fashion brand has to be about clothes, solely, you’re going down the wrong path. The variety of aspects you look at around a topic, such as fashion, are still often in the realms of what your client can offer expertise in.
Infographics These data visualizations can simplify complex information and present key takeaways in a clear and concise fashion. Diverse content B2B buyers aren’t satisfied simply with lengthy white papers. They crave a variety of engaging formats. Include a variety of content types in the content strategy.
Emerald Publishing is a global publisher that aims to make a real impact in the academic sectors that they operate, and we were tasked with launching a campaign in honour of International Women’s Day that celebrated women in academia who are often battling against a lack of equality and old-fashioned systems.
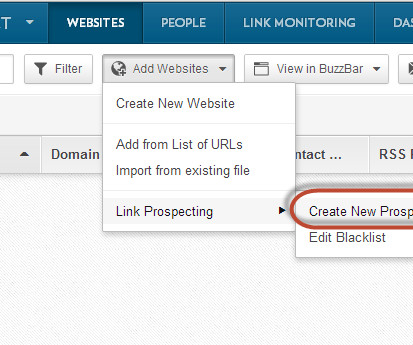
While importing curated lists like the lists from Alltop is a good start, sometimes you’re looking for specific opportunities – like infographic placements or product reviews. For example, having many posts with ‘INFOGRAPHIC’ in the title means the site posts infographics.
At this time, most marketing-related Stories focus on fitness, fashion, retail, technology, airlines, automobiles, travel, food and drinks. Infographic via 99firms.com. The other types of Stories worth mentioning, in decreasing order, are influencer takeover, live events, how-to guides, fan content, contests and others. Bottom Line.
Emerald Publishing is a global publisher that aims to make a real impact in the academic sectors that they operate, and we were tasked with launching a campaign in honour of International Women’s Day that celebrated women in academia who are often battling against a lack of equality and old-fashioned systems.
3 Tips for Effective Infographics: Data, Design and Distribution [UML]. Changing one’s environment, surrounding ourselves with creative personalities, and plain old-fashioned hard work are elixirs for finding “everyday creativity.” 3 Studies that Challenge Marketing Assumptions [UML]. 2) How we might get our creativity back.
Pharmaceutical giant Eli Lilly incorporate its 136 page integrated report into a microsite that also houses videos, infographics and charts to tell its story, all communications tactics that are growing in popularity in corporate sustainability reports. Ensure that your key media contacts have access to the latest report.
Our take on PR Couture: While PR Couture’s content is mostly tailored for fashion and lifestyle communication pros, we encourage all to take a look at their blog. Our take on HubSpot: HubSpot delivers wonderful content, infographics and templates to help guide your marketing techniques.
Several years ago PR community actively discussed infographics – a new exciting format to present complex information. While there is nothing ground-breaking about infographics anymore, it is still widely used by brands today. Companies that were the first to embrace infographics! Conducting media monitoring analysis.
In this sense, the webinar doubles as something akin to an old-fashioned press conference. 10) Create an infographic based on key points. The many lessons, principles, or essential elements the speaker makes…this is ready-made content for an infographic. Don’t get overzealous in inviting traditional reporters to webinars.
While importing curated lists like the lists from Alltop is a good start, sometimes you’re looking for specific opportunities – like infographic placements or product reviews. For example, having many posts with ‘INFOGRAPHIC’ in the title means the site posts infographics.
Since its launch in 2010, Pinterest has provided me with a space to collect content from around the Web, such as recipes, quotes, home decorating ideas, life hacks and fashion inspiration. There are a plethora of online tools to produce colorful and noteworthy infographics, photos, charts and so much more.
Experiment with new formats, like video, infographics, or illustrations to increase engagement. Industries with rapidly changing trends or evolving information, such as technology, fashion, or healthcare, often benefit from more frequent content refreshes to stay relevant and competitive. Ensure images load quickly.
For example, if you sell sustainable fashion, collaborating with influencers in the eco-conscious community can help you connect with consumers who are passionate about ethical and environmentally friendly products. These tools offer user-friendly templates and editing features that can elevate your content.
For instance, this Consumer Survey from Fashion Revolution ranks for the key term “fashion survey,” which gets 30 searches per month. From social media graphics to infographics, Canva streamlines the process with helpful templates for many projects. More searches mean more potential coverage.
According to a recent Maxwell PR study (see infographic below), 35 percent of top food bloggers reported spending more than 35 hours per week on blogging and 43 percent estimated that they’ll prepare more than 20 sponsored blog posts in 2016. Trend #1: Blogging is now a full-time job.
For example, a survey piece, a data study, or a story with heavy visual elements like an infographic or map could all be considered hero content. For instance, a brand may utilize datasets to create a map or infographic and pitch it together. Ahrefs , Majestic , Semrush , and good old-fashioned Googling can help find backlinks.
It takes ingenuity, perseverance and good old-fashioned sleuthing to make your cover letter stand apart to ensure your resume is viewed. For a quick peek at 15 common spelling errors in cover letters and resumes, check out this article and infographic by Scott Dockweiler: Mistake #5: Declaring: “I’d be a perfect fit for your company.”.
Value can be something like a pitchable asset, such as this construction statistics post, which includes an infographic that can be pitched for coverage: But another way to create value is by using proprietary data for your statistics posts. And to make something pitchable, you need to give something of value.
In particular, I was intrigued by the China team’s creative cartoon infographics that tell interesting B2B tech stories. Coincidentally, about two weeks after my presentation, Jason Cao, our general manager of Hoffman China visited the U.S. Moreover, I found the strong business momentum of the China team motivating.
But it was Swift’s daring collaboration with last December’s Victoria’s Secret Fashion Show that demonstrated she could make any cross-brand deal work. Are you taking your target audience behind-the-scenes with a podcast, infographic, video, event or webinar that they, and only they, can access for a limited time?
Using Data from Third-Party Data Sources There will be costs involved in conducting these surveys, so if this is outside your budget, you can always rely on good old-fashioned research to gather various sources of information. Tip: Use a survey calculator like Pollfish ’s to determine the costs of a survey campaign. Businessfinancing.co.uk
No datasets existed, so he was forced to gather the data old-fashioned: manually asking 10,000 questions to a Google Home and recording the answers to create a proper data study. Reddit’ r/dataisbeautiful and r/infographics Reddit is a treasure trove of great content from around the web. Remember StumbleUpon – it’s back!
Check out consumer lifestyle, men’s, women’s gift guide opportunities, but go much, much deeper to determine who is editing guides for the tech-savvy, fashion-forward, millennial and on and on. So the timing is perfect to start outreach to different categories depending on the product or service.
Cool infographics. Bloggers created content on fashion, food, and thousands of other niche passions. This started with researching what content was really successful and who was successful at this. For content, this included: Listicles. Big full-screen images. Curated video content. The best sites that were doing this were: ViralNova.
Another consumer survey from Fashion Revolution , which ranks for “fashion survey,” only gets 50 searches per month but has accrued 201 linking root domains consistently since it was published a few years ago. But when you look at the coverage, barely anyone shared the infographic or in-post images.
As traditional news outlets shrink, organizations are learning to tell their stories in a journalistic fashion through text, photographs, infographics, videos and other means. These days, every company must be a publisher.
Linking tactics means that you’re scheduling your tasks in a sequential fashion designed to achieve the best results. I’m not sure why it works so well but for eBooks, white papers, infographics or anything related to cause marketing, get going with Pinterest. It’s easy and it works to build reach fast.
They currently serve businesses in the fashion, beauty, lifestyle, travel, food and family space. Check out the infographic below for tips on how to run your holiday marketing campaigns and let’s discuss in the comments! She's also the co-creator of street style blog, StreetScoutMe. You can connect with her on LinkedIn.
Here are a few ideas: turn it into a blog post, prepare a webinar, submit it as a session for a conference, publish an infographic, repurpose content for social media, etc. Creativity and CMOs will come back into fashion. The list goes on. 30) Creativity and CMOs will come back in style.
We organize all of the trending information in your field so you don't have to. Join 48,000+ users and stay up to date on the latest articles your peers are reading.
You know about us, now we want to get to know you!
Let's personalize your content
Let's get even more personalized
We recognize your account from another site in our network, please click 'Send Email' below to continue with verifying your account and setting a password.


Let's personalize your content