This site uses cookies to improve your experience. To help us insure we adhere to various privacy regulations, please select your country/region of residence. If you do not select a country, we will assume you are from the United States. Select your Cookie Settings or view our Privacy Policy and Terms of Use.
Cookie Settings
Cookies and similar technologies are used on this website for proper function of the website, for tracking performance analytics and for marketing purposes. We and some of our third-party providers may use cookie data for various purposes. Please review the cookie settings below and choose your preference.
Used for the proper function of the website
Used for monitoring website traffic and interactions
Cookie Settings
Cookies and similar technologies are used on this website for proper function of the website, for tracking performance analytics and for marketing purposes. We and some of our third-party providers may use cookie data for various purposes. Please review the cookie settings below and choose your preference.
Strictly Necessary: Used for the proper function of the website
Performance/Analytics: Used for monitoring website traffic and interactions
Here at SHIFT, we coupled our love of candy and data to create the infographic below ( click for larger image ) showcasing consumers’ Halloween candy buying and spending habits. Like most creative pieces, the infographic was an evolution and team effort that didn’t happen overnight. Or where they’re buying them? Zach Burrus.
Our 2015 Social Journalism Study explores how media professionals use social media in their daily lives. Germany, Finland, Sweden and Australia, the study provides insight on how these journalists agree on a variety of topics, yet differ in their use of social media. Click here to read the full study! It’s free!
With Question 4 of the 2017 Shareholder Communications 365 Study, we learned that only 20% of institutional investors visit your investor relations website to read your news releases. Additionally, the Rivel Research study also confirmed that 75% of institutional investors want your earnings release (in full) in the work terminal.
Once you identify a study and topics of interest, you can then take existing research and build your own infographics to showcase the information. Google Databoard lets you search, find and create visuals, highlighting important stats from studies, without you doing any of the heavy lifting (the actual research).
As Cision’s 2016 Global Social Journalism Study notes, email continues to not only be the most common form of contact between journalists and PR professionals, it’s also the most preferred. So master your email pitching skills, but continue to hone your understanding of how journalists use social media.
Many journalists now prefer to be pitched through social media rather than email. Building Media Relationships Without a PR Firm Personal outreach beats mass pitching every time. When you do pitch, keep it brief and relevant. Journalists receive hundreds of pitches weekly.
Data-driven pitches win points with journalists. Journalists look for pitches that are backed up by data in the form of charts, graphs, tables, or interactive infographics. It offers a clear story map and lends credibility to the pitch. Infographic from a 2017 article in MarTech Advisor.
Infographics remain high on the marketing list of tactics. This week I looked at Google search data for the word “infographic” (and variations) and found interest continues to grow at a steady pace. We see infographics in content marketing survey results as well. But Those Troubled Infographics. 1) Data visualization.
Case study: Duolingo's unhinged TikTok digital PR content There's not a single chance you haven't heard about their brand image. Case study: Notion's user-driven digital PR strategy Did you know that Notion's growth wasn't fueled by traditional public relations and press releases? Try Prowly free for seven days - no credit card needed.
In 2017, Forbes reported : “Most B2B buyers say they rely heavily on white papers (82%), webinars (78%), and case studies (73%) to make purchasing decisions. Close behind are e-books (67%), infographics (66%), and blog posts (66%).” Business buyers prefer hard, unbiased data over sales pitches and marketing collateral.
The two most popular tactics digital PRs use are pitching data-led content (95%) and providing expert commentary (93%). In our study, 51% of respondents dont know their average cost per link. BuzzStream ) Our media databases study showed why Muck Rack is consistently one of the top-used list-building tools due to its accuracy.
According to a study by Cision, 91% of PR professionals believe content marketing is becoming more important to their success. PR focuses on building and maintaining relationships with media, stakeholders, and the public, while content marketing aims to attract and retain audiences through valuable, relevant content.
And that means all of them are sending pitches to reporters – the same reporters you’re pitching. But if your pitch sounds exactly like every other brand’s, it will get ignored. So how can you make your pitch stand out? It’s time to make a change to your pitching style! All brands want media coverage.
In this interview, Daher sat down to discuss with me the challenges of being a new agency owner, how to deliver effective pitches, and how she’s embracing the many changes in the field of PR. I become a mini-expert on the journalist I’m pitching. before sending any pitch. How did you get your start in PR?
For example, I found this great study on food delivery trends based on proprietary data from GrubHub. The authors of these stories can quickly become journalists to target for follow-up stories, additional quote pitches, and more. Between creating content and pitching, I barely had time. What to do with them?
Here’s a look at statistics across PR, marketing, and social media that were surfaced in the various reports and studies covered on this blog throughout 2020. Many of the blog posts published here are based on survey research, analytical studies or other sources of data. Source: 3 Studies Branding and Marketing ).
They may be referred to as “indexes,” “regional studies,” “city studies,” or “city listicles.” For this post, we’ll call them “city studies.” But, city studies have other higher-level goals, from SEO to brand awareness. Ego bait Ranking high on a city study makes a city look good. It’s something to brag about.
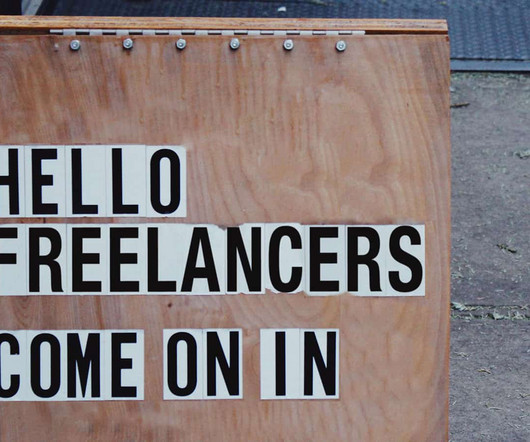
Marketers typically think about lobbing their pitch at prospective clients, but the same exercise could help you onboard freelancers. Style guide and pitch guide What’s your stance on the Oxford comma? A freelancer can’t pitch you ideas effectively without knowing at a high-level what you’re looking for.
Public relations professionals are always seeking new ways to get their clients’ stories out – from pinning down the right message to crafting a perfectly tailored journalist pitch. Grabbing their attention can be tricky but is made far easier by studying their coverage and engaging with them personally or on social platforms.
Perfect your pitch. You can and should pitch your created, or “owned,” content to the media. Write concise, clear pitches to key media contacts. Include links to your content assets – many times your pitches aren’t viewed because they hit the firewall and were either sent to spam or returned to you. Put out the signs!
link] Cyrus Shepard’s Internal Linking Study : An in-depth analysis of internal linking strategies and their impact on SEO. I mean, you, uh, did a couple great studies on kind of the impact that you saw across your clients, I think that’s what you’re referring to that like 10 or 20 percent decrease. Vince: Yeah.
Propel says PR is sending more pitches; Muck Rack adds podcast contacts and broadcast monitoring; several PR tech vendors publish survey results “Welcome to May. PR is sending more pitches during COVID-19 The average PR pros appear to have sent more media pitches during the Coranavirus pandemic than before it’s occurrence.
Media love poll-results story pitches, especially when accompanied by visuals like infographics. You can cherry-pick studies from different sources, combine and cross-reference to yield an original piece of secondary research – and a story. Whatever the outcome, it’s likely to yield fascinating material for content.
To continue with the eczema example – that brand could publish research they initiated or participated in, or at least studies that support how their product works. Create a pitch that will appeal to the media – research with an interesting infographic often gets good results. Pay for social ads aimed at a targeted audience.
A 2014 study of more than 72,000 Facebook pages shows that visuals, including video and photos, generate the highest levels of engagement among users. Check out the “PR Starter Kit” for pitching tips and more! Visuals are vital for all types of communication, whether they’re still shots, videos, infographics or slides.
Once you’ve built that reputation, when it comes time to pitch, journalists will remember your name and will be more likely to give your story a chance. According to Cision’s 2015 Global Social Journalism Study , 39 percent of journalists see experts as an important source of information. It Establishes Your Expertise.
What I wasn’t initially anticipating within the field is the creativity, anticipation and thrill it entails when conceiving campaigns, writing pitches and landing links. In terms of preparing pitches, there’s a fine balance between ensuring the client is credited in coverage and making the email too brand-centric.
Most of what I did wasn’t a secret: I read what reporters wrote before pitching, developed subject lines that got my emails opened, and use a strong lede in all my pitches. There was one aspect of my success that was different: I wrote long pitches. This finding is in line with the findings in the study above.
You can find out what they do behind the scenes if you look for case studies (do a search for “case studies for company ’x’”) that take a deep dive into their innovative tactics. Case Study in Innovation Outside a Niche. Hustle and pitch. Cool infographics. Big full-screen images.
As regular readers know, I often pour over marketing studies on these pages and sometimes produce survey cliff notes stemming from multiple reports. That brings us to content marketing and the adjacent reference to lead generation in this study, which I think can be confusing. This study was conducted by email in June 2016.
They’re written in an objective way and often contain quotes, statistics, infographics, and eye-catching headlines. This will increase the likelihood that they’ll accept your pitches and publish your press releases. They Build SEO. Press releases are also another kind of unique and valuable content for your website.
For example, surveys about our about the coming election might have seemed redundant during our poll-heavy and lengthy campaign season, but the “ top American fears ” hook for one annual study was not only well designed, but well packaged and the result was truly newsworthy content. Keep the results you’re looking for in mind.
Are PR pros pitching journalists the way they prefer? According to Cision’s 2015 Social Journalism Study , that answer is yes: 58% of U.S. In addition, PR pros are now contacting journalists using the methods they actually prefer, with 23% pitching stories on social platforms — in line with reporters’ preferences.
These insights form the foundation for our infographic – a must-see for any PR pro! Print media (magazine) consumption rose in 2023 , and this trend should continue in 2024, according to a study by Pew Research Center (via MediaPost). 7 Reasons Traditional Media is Still Relevant in PR 1.
Paid Social: Cliff Notes to 3 Social Media Studies. Trust Economy: Summaries to 4 Content Marketing Studies. 2) Best to Pitch in the Morning says Reporter Survey. The best time of day to pitch reporters is in the morning, according to a Business Wire survey covered by the MediaPost.
Pitch Data Studies Data studies have always proven to be great sources of high-quality backlinks, provided the data is interesting and packaged correctly. Once you find your data sources, develop a compelling story complete with findings and some graphics, and then pitch these to journalists via email and/or press release.
Post an infographic (check out www.Fiverr.com or www.Canva.com to have on easily made). The other thing you can do is use this content as media pitches. Create Content Using Media Pitches. Check out this comprehensive list: Share an inspirational quote. Answer a frequently asked question. Post something seasonal. Share an image.
Marketers typically think about lobbing their pitch at prospective clients, but the same exercise could help you here. Style guide and pitch guide. Along with the style guide, you should also send your freelancers a pitch or brief guide, which can live as a PDF, Powerpoint deck, or Google doc. Gather a portfolio of past success.
Study the media. That’s the theme for this week’s Unscripted Marketing Links (UML), where on the occasional Saturday, I examine three links to stories or studies, detail the findings and wrap them in insight. The best pitches are short emails in the morning. Most journalists (65%) prefer to be pitched before 11 a.m.
This case study is about a time when I worked with a local NYC pest control company that was on the verge of complete death and brought them back to life with the help of some creative marketing chops and massively helpful tools like Buzzstream. Creating a straight-up pest control infographic would be content marketing suicide.
A recent study by the Content Marketing Institute and MarketingProfs shows: 2015 B2B Content Marketing Trends. Others may want visual content, such as video and infographics. Pitch your written and multimedia content to reporters. Seventy percent of B2B marketers create more content now than they did one year ago.
The Duke Study was far more definitive on marketing priorities than the Salesforce State of Marketing survey , which was also published recently. The Duke study found that marketers also say their efforts earned 3.1% A perusal of the study, which is embedded nearby, provides additional points of interest. in next five years.
Q1: The Track Maven study showed that while content publication and distribution from brands and companies is up by 35% engagement is decreasing. But I am saying think about what image (this also goes for video and infographics) will make you want to click, follow, comment, share, etc. How can visual content help with engagement?
Q1: The Track Maven study showed that while content publication and distribution from brands and companies is up by 35% engagement is decreasing. But I am saying think about what image (this also goes for video and infographics) will make you want to click, follow, comment, share, etc. How can visual content help with engagement?
We organize all of the trending information in your field so you don't have to. Join 48,000+ users and stay up to date on the latest articles your peers are reading.
You know about us, now we want to get to know you!
Let's personalize your content
Let's get even more personalized
We recognize your account from another site in our network, please click 'Send Email' below to continue with verifying your account and setting a password.


Let's personalize your content